The idea of the Standard Setters was straightforward. In order to allow investors a focus on recurring, business-related and controllable earnings components the whole comprehensive income (i.e. the change of equity that is not due to company-owner transactions) of a company is split into two components for reporting purposes: a) the profit & loss statement (P&L) and b) the so called other comprehensive income (OCI). The OCI comprises all changes in equity that are not seen as relevant for understanding the recurring performance of the company or might even mislead investors (and that are not due to company-owner transactions) such as actuarial gains and losses on defined benefit pension plans, unrealised gains and losses on certain securities, effects from translating foreign currency financial statements into the home (functional) currency and certain revaluation effects. Some of these effects might be recycled to the profit and loss statement at a later point in time, some not.
In fact, there is a lot of debate around the nature of OCI with a fair number of investors arguing that there is a lack of systematic structure about which components to include into OCI. And they are right. Depending on the business model of the reporting company it sometimes seems more appropriate from an economic point of view to include a certain accounting item into OCI, and sometimes less so. At the extreme, we can see even situations where the economic logic seems to be turned upside down, as is the case for the P&L/OCI of the Spanish bank Santander SA.
Santander is not a local European bank, it is also doing big business via its foreign entities in Latin America: Brazil, Mexico, Chile and Argentina. And all these countries have one thing in common: They are (on average, over time) more inflationary countries than Spain (or the Eurozone). Interestingly, for doing investment business in inflationary countries financial theory has two concepts that can tell us what we can expect to happen in capital markets of the inflationary countries (i.e. the Latin American countries) on the one hand and of the home country (i.e. the Eurozone) on the other hand. These two concepts are the interest rate parity (IRP) and the purchase power parity (PPP).
Under these two theories we should see – under certain circumstances and in perfect markets – a) higher interest rates in Latin America than in the Eurozone and b) a depreciation of the Latin American currencies as compared to the Euro. In an ultimate market equilibrium this means that it doesn’t matter here whether a Euro-investor invests in the Eurozone at lower interest rates or in Latin America but with higher interest rates being partly eaten up by exchange rate losses. Admittedly, in reality there are also some other factors to include into the analysis, and international capital markets are not at all perfect. In the context of Santander, it is e.g. worth noting that home interest rates are artificially driven down by the quantitative easing activities of the European Central Bank ECB. However, this does not weaken the general message here: the IRP and the PPP are in many real world cases a good indicator for the direction of market movements.
And in the case of Santander it really worked exactly as it should: Relatively attractive interest rate income in Latin America has been partly compensated by constant currency losses over the years. As predicted by IRP and PPP, it has been a closed-circuit transaction from an economic point of view… but unfortunately not from an accounting point of view.
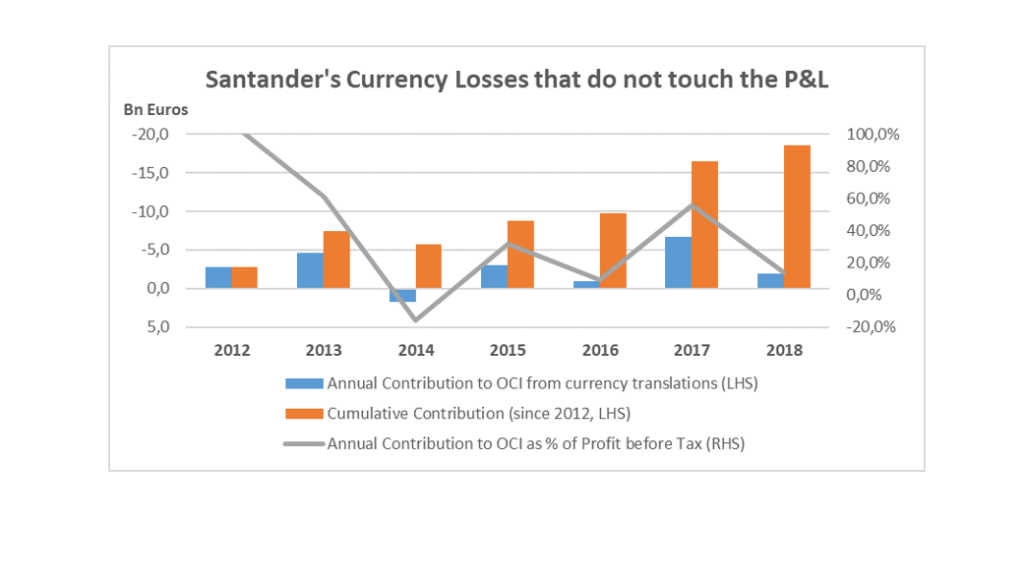
According to the above explained idea of OCI, in its financial reporting the high interest rates have flown into the Santander profit & loss statement but the currency losses only show up in OCI. Looking at the numbers since 2012 (information on the years before is a bit blurred, that’s why it is left out here), we can see that Santander constantly built up negative exchange rate positions in OCI which cumulatively amounted to 21.7 bn Euros at the end of 2018 (adjusted for the net Argentine Peso balance which has been transferred to other reserves according to IAS 29 [hyper-inflationary economies] in 2018). This accumulated amount compares to a current market cap of Santander of roughly 71 bn Euros – quite a big portion that got lost during the last seven years due to currency effects, and all this without touching the profit & loss statement at all.

We can see in the graph that in the recent past the only year that did not contribute to this negative balance was 2014 which is due to the strong GBP and USD appreciation against the Euro in this year. And we can also see that the currency effects made up a big part of total comprehensive income in at least four of the seven years under analysis (here measured as percent of profit before tax).
Two aspects about this phenomenon are worth shedding some more light on:
- The split between P&L and OCI is not per se a bad idea. Even if the OCI component is quite material in many cases. It is a bit similar to the idea of companies presenting “underlying” earnings in order to better inform investors about the recurring nature of their business. But the idea of OCI clearly rests on more comparable and more solid feet than the often subjective and blue-sky-driven definitions of companies (for some real world examples of misuse of the recurring-earnings-presentation-game in practice, see https://valuesque.com/doms-underlying-earnings-definition-the-profit-before-cost-financial-analysis-problem/. In the case of Santander, however, it is the business model that clearly links the currency exchange movements to the sustainable success of the company. It is not about doing business in other countries with all the related risks (FX risk being one of them). It is about locking in a closed circuit transactions of high interest rates and associated currency losses with every single transaction. That is why a classification of currency effects as Non-P&L does not make any sense here from an economic point of view.
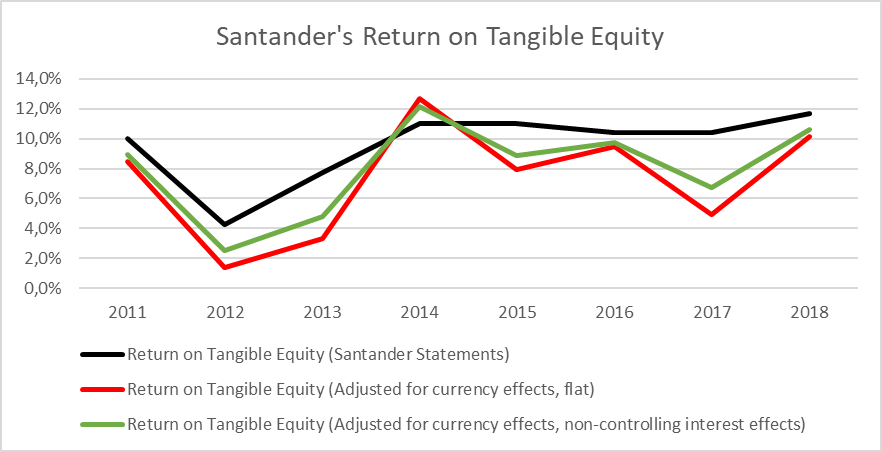
- One of the key components of Santander’s long-term management remuneration system is the return on tangible equity (RoTE). This ratio is calculated by dividing the profit attributable to the Santander group by the tangible equity of the group. If we now include the currency losses into the calculation of profit for analytical reasons, we can see that the company looks a lot less successful than it states.

The graph shows two adjusted versions of RoTE, one where all periodic currency losses are recycled to the P&L for analytical reasons, and one where we have taken into account that some of the currency losses are not attributable to the group because of existing minority-stakes (we had to make some assumptions here). However, the message is in both cases the same: Except for 2014 the adjusted RoTE performance is much weaker than stated in every year since 2012. Moreover, the volatility of RoTE also seems to be much higher in the adjusted cases.
The Santander example also highlights a general problem of IFRS, or better: the real life of IFRS application. While the standards (IAS 1) know the possibility of a principle override if a presentation according to single standards would lead to a misleading impression of the company’s performance, auditors in fact rarely dare to go for it. And as we know from history: If you have a sword and your people believe in your fighting power but you don’t make use of it, then your people might sooner or later be running headlong into the disaster.

