

Abengoa S.A. (now bust) applied this technique heavily, Carrillion plc (now bust, see LINK to our former blog post [only in German]) too… and recently short seller Muddy Waters seemed to have it detected at NMC Health plc (LINK to the report), followed by a steep stock price decline of the United Arab Emirates based and UK-listed healthcare company. And NMC didn’t even deny this in a response where the company stated that it had never given the impression that this technique is not part of its business: You know already what we are talking about: In this blog post it is about a technique called reverse factoring – or more generally often: supply chain financing.
The examples above are certainly only the tip of the iceberg. Supply chain financing facilities are booming across the whole international corporate landscape, sometimes just as a normal tool of working capital optimization, but not rarely somehow associated with companies who want to dress-up their books or are in financial trouble already. So we think it is worth to disentangle this technique and explain why it is the preferred tool of companies who want to benefit from the “Three-is-a-Crowd” illusion.
Let’s start with the naked technical details. What is reverse factoring? While in a normal factoring situation companies sell (or at least transfer) some receivables to a bank or other factoring company before time of collection in order to early monetize these receivables, reverse factoring rather targets the liability sibling of accounts receivables: the trade payables! In reverse factoring the company uses a financing institution either for a) paying its suppliers earlier than the usual terms of payment would require, b) paying its suppliers in time, but with a payment duty of the company to the financing institution at a later point in time, or c) a combination of both. The following graph highlights the technical functioning of cases a) and b) as compared to a situation without reverse Factoring.
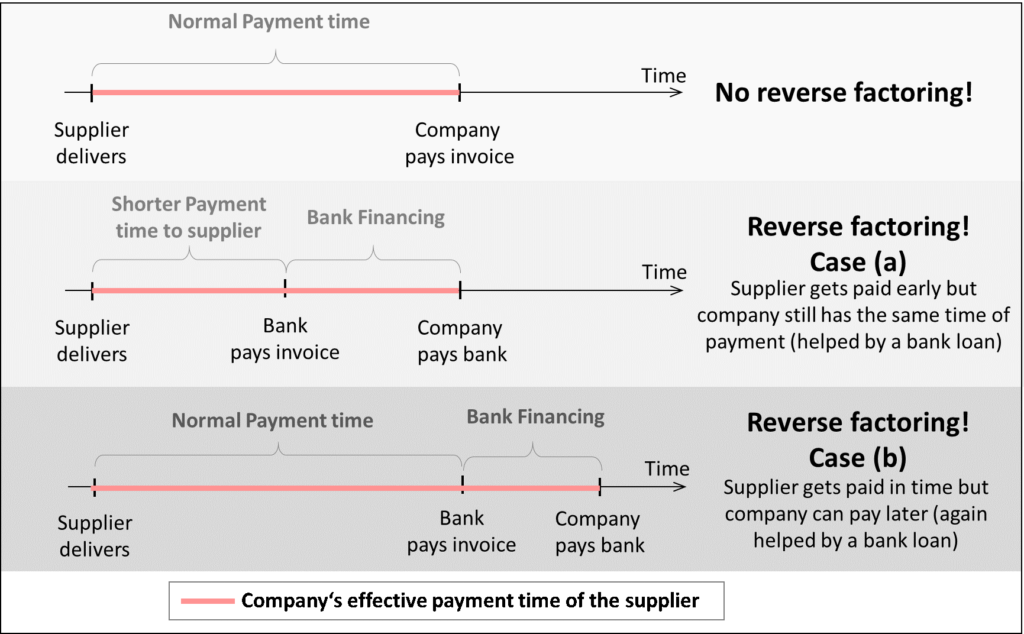
Of course the company has to pay a price for such supply chain financing, i.e. they have to pay interests. And I think that it is not a big surprise for readers that such techniques are clearly a sort of financial debt: Making use of a bank or similar to get a dedicated short-term interest-bearing loan on a more or less revolving basis. And that is it already from a technical point of view, not much of a mystery…. But stop! Things would be too simple if we only look at the isolated technical details. And in fact: Reverse factoring touches a big behavioural financial statement analysis topic: the intertemporal cash flow development analysis, or better: the “Three-is-a-crowd” problem!
So what is this “Three-is-a-crowd” problem? In very simple terms it goes back to typical techniques applied by financial analysts when trying to find out more on the “earnings’ quality” of companies. The underlying question is here: How good of a measure are accounting earnings as an indicator of future cash flows? This is an essential analysis step as current (or historical) accounting numbers are often the most important basis for deriving estimates of the future cash flow generation ability of companies. This ability then should flow into our valuations (e.g. discounted cash flow techniques) or at least in to our credit analyses (coverage questions). Usually, earnings quality is seen as “high” if accounting earnings translate stably into respective cash flows, i.e. if the non-cash components of earnings (the so called accruals) somehow even out over time. The translation of earnings into cash flows is generally called “cash conversion”. And it goes without saying that for analysts normally a poor cash conversion (i.e. if earnings fall short of cash flows) is a sign of deteriorating business fundamentals in the future, and vice versa. This assessment is just a consequence of the nature of our accounting systems. As cash conversion is such an important topic, we are going to shed some more light on it in one of our next blog posts.
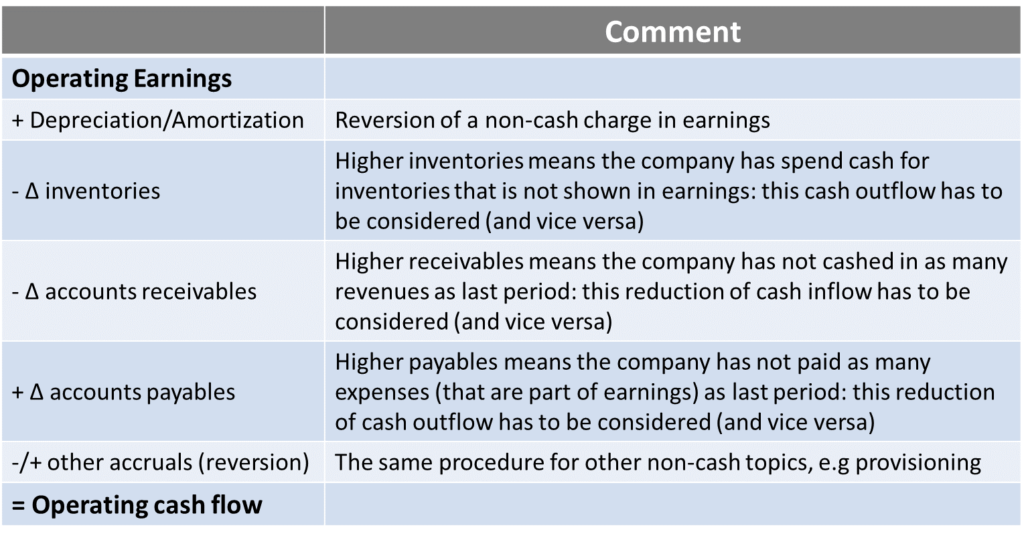
But staying with reverse factoring here: what if a company feels that even if earnings are still ok, cash collection might become difficult in the next years? Or if companies want to strengthen their operating cash flows anyway? And this is the time of the “Three-is-a-Crowd” technique. When we look at the cash generation of the operations of a company we usually analyse the operating cash flow of a company. And this cash flow is not just a function of the pure buying-input-selling-output process of companies, it is also a function on how companies manage the payment terms to their input and output counterparts (suppliers and customers). To put it differently: If companies manage to prolong their payment duties to suppliers or manage to early collect payments from their customers, then this also has a positive effect on their periodical operating cash generation. The following graph illustrates this in a slightly simplified form for the derivation of a single-period operating cash flow (starting point: accounting earnings).
Of course, a one-period positive effect (e.g. from collecting a big customer’s payment early: reduction of trade receivables: positive cash flow effect in this period) would easily be spotted by financial analysts as what it is: a one-period effect. Probably reversed in future periods. And also for two periods, financial analysts usually are able to detect it as a transitory effect. Analysts know that there are some normal intertemporal variabilities between earnings and cash flows. But what if this effect is seen as sustainable over time? Then it would seem to be structurally positive. And it does not take many periods to make such effects seemingly sustainable: Often three periods are enough for analysts to feel that there are some structural positive patterns (just imagine a typical MS-Excel-Model where you see three historical periods with certain ratios, this is often the basis for at least some soft extrapolation in the future): Three is a crowd! If something goes on over so many periods than it should be lasting, many analysts think. With the respective consequences for future cash flow projections. As a matter of course this works only if analysts can only rely on the time series patterns and do not get any clear information on the transitory effect of the cash payment or collection patterns.
But how does the reverse factoring game play into this finding? Well, in the way it is often seen in practice it is such a nice hidden “Three is a Crowd” technique. Usually its characteristics are as follows:
- The positive starting point for evil companies is: So far there are no duties for companies to publicly declare whether they engage in reverse factoring activities (or supply chain financing activities in general) or even classify them as financing, i.e. financial debt. This helps to hide what they do! Side comment: As what is written in this blog post is not a super-new evidence (most forensic analysts clearly understood the problem probably since the Abengoa fail in 2015, but definitely since the Carillion fail in 2017), it is a big surprise that it took the big four auditors in the US until 2 October 2019 to write a letter to the Acting Technical Director of the FASB requesting a clear indication on disclosure and cash flow statement representation of reverse financing techniques. Well, at least now they woke up.
- With this non-disclosure advantage, companies do not declare the supply chain financing activities as what they are (i.e. financing) but rather hide it away as a part of the payables settling process (i.e. operating) – either actively or silently (e.g. by not mentioning the existence of supply chain financing techniques at all). This allows to keep all the effects of this technique as part of the operating cash generation process of the company.
- Next, companies build up their position stepwise. I.e. they do not change their whole payables position into a reverse factoring position at once, but start with e.g. 30%, next year they enlarge it to e.g. 60% and the third year to e.g. 90%. This allows them to benefit from the “difference” (i.e. the step-up) every year. Remember: The operating cash flow effects are always the differences in the working capital position. With this they create the illusion of sustainability of the effects (“Three is a crowd”).
- The real good (better: evil, super-cheater, etc.) companies play the above mentioned combination of case (c) (i.e. shortening the payment terms for suppliers by simultaneously increasing its own payment terms). Why? This allows them to benefit from another aspect: If your suppliers get paid earlier you can also talk them down to better contract terms, i.e. lower costs. Consequence: The gross margin of such companies increases, showing an additional periodical positive effect to the pure accounting earnings (and cash flows as well). So it seems as if these companies get really better in terms of their operating performance no matter what perspective (accounting or cash flow).
As always: If something cannot go on forever it will stop! And from these explanations you can clearly see the endpoint. But usually analysts do not have this information before the endpoint, they cannot easily spot this development, and with the described technique the illusion of a sustainable development is already laid after three periods. A perfect delay of performance weakness. And certainly some managers have already cashed out before: Après nous le deluge!
Admittedly, sometimes a two-is-a-crowd technique also works, and sometimes it needs a four-is-a-crowd! This really depends on the circumstances. But three periods is – at our experience – really the often found trigger for making most financial analysts think that a trend is sustainable. And it is also something that companies can effectively manage as a transitory period for changing their asset or liability duration periods. It is the sweet spot of cheaters! But if companies can go for even more periods: even better for the illusion.
Let’s look at the Carillion case, which finally exploded in early 2017, for example:
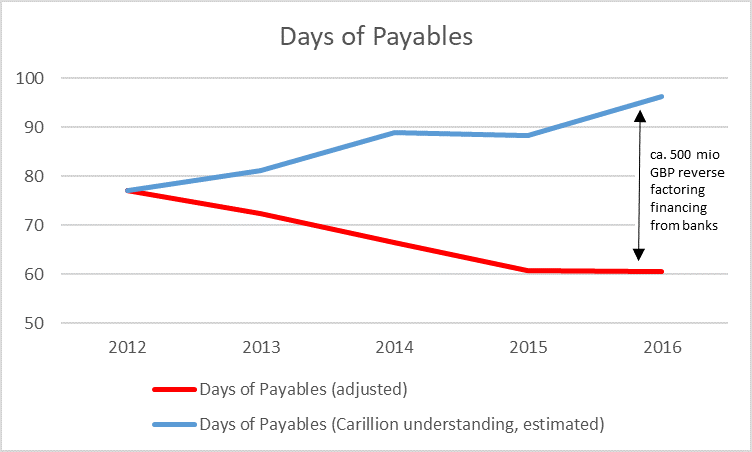
This figure confronts the communicated payables position (blue line) with the payables line according to our understanding (red line). The numbers are partially estimated as clear information is not available. By engaging in reverse factoring of the case (c) type Carillion managed to pay earlier its suppliers by simultaneously massively increasing its payables position – because they kept the bank financing as part of their operating liabilities in its communication. For analysts this looked like a constant periodical operating cash inflow – here even over four periods.
So, for an analyst who wanted to analyse earnings quality or cash conversion of Carillion at the end of 2016 the following picture showed up:
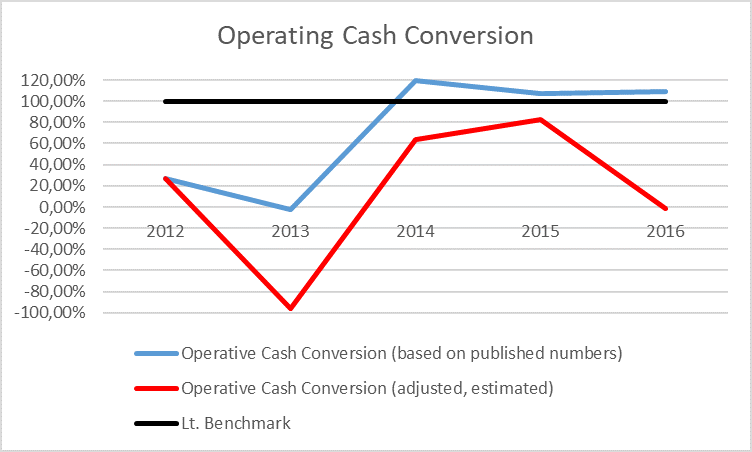
Obviously, if one trusted the numbers communicated by Carillion cash conversion looked fine between 2014 and 2016, but not so if looking at the real economics (i.e. by treating the financing as financial debt).
NMC Health also shows some typical patterns. While we haven’t look deeply into this case so far, we can already see the typical increase in the days of payables (just as a comment: Muddy Waters also claimed to have found indication of reverse financing at NMC Health by looking at disclosure of dedicated bank instruments, so further supporting its findings):
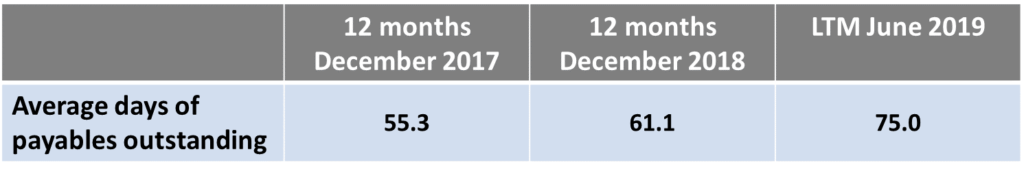
Source: Muddy Waters, NMC Health report, 17 December 2019, p. 26.
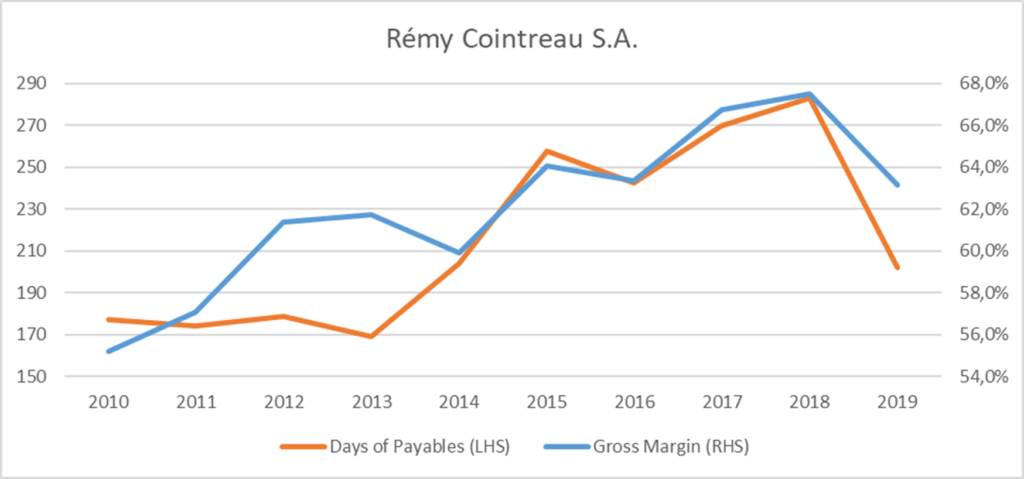
In order to not only doing post-mortem analyses, we also want to highlight different case (which is far away from bankruptcy and has already solved in a way): The French spirits company Rémy Cointreau S.A. While we do not know for sure whether the company really engaged in some sort of supply chain financing activities (and we do not at all want to blame it here!) we can see between 2015 and 2018 the typical patterns of three to four period days of payable increases combined with an increase in gross margins that are typical for reverse factoring. Rémy Cointreau always popped up at the top of our reverse factoring detection screens. In its 2019 fiscal year accounts, however, the patterns have greatly disappeared. But do your own analysis to find out why.
As you can see from the examples, it is obviously exactly this combination of non-disclosure requirements, hiding possibilities and smart (i.e. stepwise and probably case (c) type) application of the reverse factoring technique which makes it such a powerful tool for delaying any operating weakness and perfectly play the “Three is a crowd” game.
Of course there are also other “Three is a crowd” techniques out there but they are currently not as powerful as the reverse factoring game. Here are some other examples of the game:
- Delaying some capital expenditures over three periods makes the free cash flow to the firm (though not the operating cash flow) look very strong. However, mostly analysts understand the problem of long-term cyclicality of capital expenditures and do not fall for it. However, there are certainly a couple of companies out there which try to look strong on the basis of an aged substance and do not want to show their real reinvestment needs.
- Building up a normal receivables factoring facility over time (again using the stepwise approach) which leads to a continuous reduction in receivables and hence to the same push to operating cash flows.
- Managing the change from a normal inventory management to a just-in-time or similar inventory management not by a big one step but stepwise over e.g. 3 periods. This also results in a period-by-period push up to operating cash flows.
As a summary: You can see that it is exactly this toxic combination of hiding the real economics, the potential for a stepwise build-up and the often found “three periods is sustainable” attitude of investors that makes reverse factoring the preferred technique currently to lead up investors up the garden path about their real operating performance. As we know from recent history (and by thinking through the whole systematic picture), this techniques finds a natural end (if not supported by a clear operating improvement) and this end is often brutal.
In order to not get caught wrongly, analysts should watch out for the following patterns: a) an unexplained prolongation of the days payables outstanding (DPO) and b) an accompanying increase in gross margins. If you spot something like this go deeper into your analysis! This check is highly necessary these days until standard setters come up with some clear rules on how to treat reverse factoring / supply chain financing activities from a reporting point of view.
But of course, there are also many, many other companies out there which engage in supply chain financing activities just for optimising their working capital and which are certainly not up to no good (Rémy Cointreau might be one of them). This is absolutely ok, although the intransparency problem often also remains a topic for these cases. So in this blog post we do not want to dam reverse factoring per se, we only wanted to highlight the big possibilities that this technique brings along for companies who have the clear motivation to mislead.
Disclaimer: As always, we hold no economic stake in any of the companies involved in this blog post – in whatsoever direction. We base our analysis on imperfect information and hence we might be wrong with some conclusions. This is just our subjective view and no investment recommendation at all.