

On 13 and 14 June 2019, the IVSC-WAVO Global Valuation Conference 2019 took place in Frankfurt in front of a truly international audience with valuation experts from all over the world – a very inspiring event. Among different speeches on e.g. eValuation or valuation of eBusinesses, I held a presentation on valuation challenges regarding companies in crisis – a topic that at first glance might sound a bit odd in the middle of all these cool IT-can-help-us and IT-keeps-us-busy themes, but which is certainly not less relevant in our current business environment than the “digital” topics in the other sessions: The end of our current macroeconomic cycle is still only a question of time…
While in a very strict sense, the valuation of distressed companies is not different from the valuation of healthy companies from a purely technical point of view, it nevertheless offers some special aspects in practical terms. This includes some new perspectives on fundamental analysis (here the so called “indirect insolvency costs” become relevant), some more requirements on accuracy of discounting techniques (e.g., negative cash flows restrict the analyst’s room for applying hands-on cost of capital calculations) and the necessity to take more into account the non-linearity of the equity value functional. This non-linearity thinking is something that valuation professionals do not like a lot, thinking in linear terms is much easier. But what works well for healthy companies, no longer works for distressed companies. This is why in this blog article I am going to shed some more light on the relevance of this latter point below.
Starting point of the analysis is a very simplistic view on the different capital positions of a company with limited liability (here only: debt and equity) and their distribution at the “end” of the company’s life. From an economic point of view, there is no real end of the company in its current shape. But from a legal point of view there is: it is the case of insolvency! (Comment: Even if companies today more and more often continue to live on after insolvency, it is a fresh situation from a capital providers’ point of view with a new capital structure and new investors – that is why for reasons of simplicity we can think of the company having an end-of-life at insolvency here from an equity investors’ point of view). At his end point the value of debt and equity – each in dependence on the value of total assets, i.e. the enterprise value – is shown below.
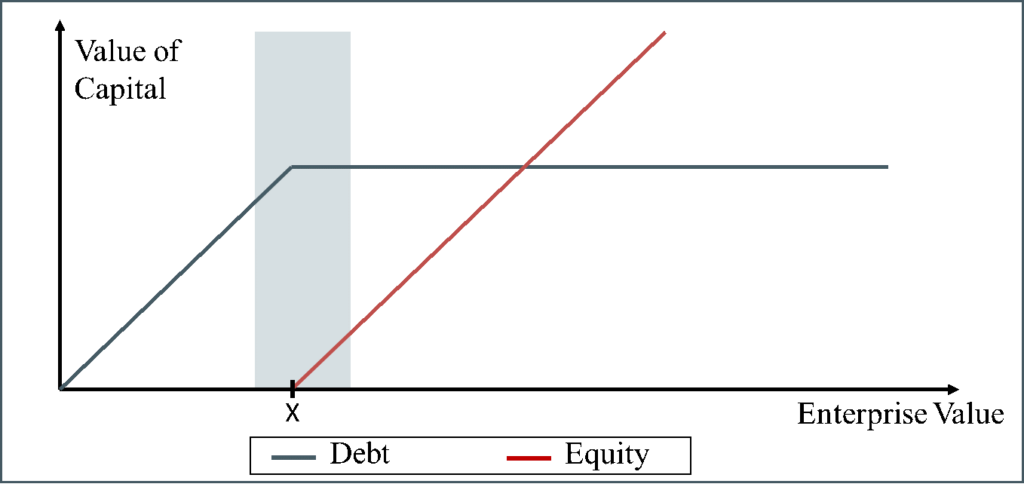
This graph reads as follows: As long as the enterprise value at the end of the company’s life is lower than or equal to the outstanding debt (point X), the debt capital providers get everything. The equity capital providers get zero (they do not fall below zero because of limited liability). This is due to the normal principle of seniority of debt. Once the enterprise value exceeds the debt value (i.e. surpasses the point X) the equity capital providers start to participate. At the same time the debt capital providers do not benefit anymore: they got paid back the outstanding loan – and that’s it for them. Now, the higher the enterprise value is the more the shareholders get. And for enterprise values higher than debt values, shareholders benefit proportionally. Sounds like great news for shareholders, but to put this graph into context of real world it has to be said that usually insolvencies take place somewhere in the region of the shaded area – so equity investors do not benefit a lot in most practically relevant cases.
When we look at the shapes of the distributions of the two capital positions – debt and equity – one can see the similarity of them to the shape of financial options at expiration. In fact, equity looks like a long call on the enterprise value with the full debt value as the strike. And debt looks like a short put on the enterprise value, again with the full debt value as the strike. And this is exactly what the capital positions are from an economic point of view!
Hence, when the capital positions are like options on the enterprise value, we can also value them similar to financial options. This is an important finding for the valuation of distressed equity in general – because as long as insolvency has not taken place we are in a similar position as an option investor BEFORE expiration. So let’s have a look on how the value of a long call looks before expiration.
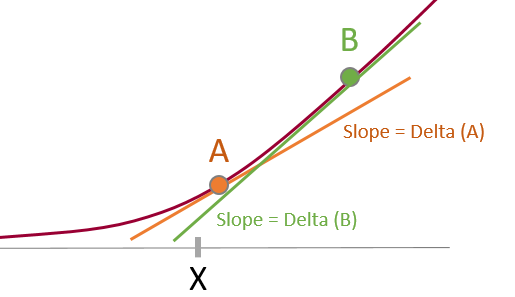
Now the formerly kinked function turns into a smoothly curved function (the dark red one in the graph, with the concrete shape dependent on some parameters such as volatility, time to expiration and risk-free interest rates in a simple Black/Scholes setting). This function now allows us to draw some important conclusions regarding the value development of distressed equity. Obviously, the closer the company is to insolvency and all other things being equal, the less the equity should react to changes in the enterprise value. In terms of option pricing theory this is expressed by the Greek letter “Delta”. The Delta is an indication for the sensitivity of the option (here equity) to changes in the underlying (here the enterprise value). The Delta (tangential line to the value function) is lower for the more distressed company A than for the more healthy company B. In fact, for very healthy companies the delta equals nearly one, meaning that the equity develops in the same way as the enterprise value – this is linearity as we like it as valuation professionals, but unfortunately this is not what we can see for distressed equity (A).
All this has some important implications for the valuation of distressed equity (so far only from a theoretical point of view). A certain assessment of developments of the enterprise value do not automatically turn 1:1 into changes of the equity value (adjusted for the leverage effect). We have to adjust them first for the Delta of the equity value (to be clear: we have to adjust debt values as well, but this is not the focus here). Not doing this would lead to an overvaluation (in case of positive changes of the enterprise value) or an undervaluation (in case of a negative change in enterprise value).
To put it in concrete terms, while the financial leverage effect helps a lot in case of improvement of the whole situation, it does not help as much as we would expect from our traditional leverage formulas or Enterprise-to-Equity-Value translations. And: while the financial leverage seems to have a horrible consequence for the equity value if things in general deteriorate based on our typical leverage formulas, it rather has a much softer consequence in reality.
The big question is now whether this nice academic view can also be observed in practice or whether it is only a technical exercise without any meaning for our valuation practice. Unfortunately, it is not very easy to check this via a broad empirical study. We simply do not have a lot of assets which are similar in general but only differ in terms of insolvency risk. But at least we have some listed assets which qualify for such an analysis. One of this pair of assets are the listed Belgian financial institution KBC NV and the also listed KBC Ancora NV. KBC Ancora is a holding company whose main purpose is to hold roughly 20% of KBC NV. KBC Ancora did not hold any more meaningful assets during our observation period, which is very good for analytical purposes because so our results are not blurred by value effects of other assets. But KBC Ancora is additionally financially levered, meaning it is debt financed itself. This means, from an economic point of view KBC Ancora is exposed to the leverage of KBC per se PLUS its own leverage. The equity of KBC Ancora therefore carries the same risk as KBC (operating plus financial) PLUS an additional risk from its own capital structure. Or to put it differently, KBC Ancora is the same as KBC (and follows the same drivers) – the only difference is that it carries a higher insolvency risk than KBC.
Of course, even this assessment is not perfectly true as there are some value-relevant differences between both companies. KBC Ancora has a higher tax shield because of the additional debt financing (positive), but also has a weaker corporate governance position (if you are a shareholder of KBC Ancora you cannot vote directly through to KBC but only indirectly – and at a non-controlling position – meaning you have much less say in KBC) and a worse cash flow access (with a roughly 20% holding KBC Ancora does not have any direct access to the cash flows, it has to wait for the dividends paid, meaning that the shareholders suffer from at least a one-period lag of cash flow access). But these effects are much more stable than the effect from any changes in the insolvency risk due to changes of the enterprise value, meaning that in a dynamic study they only play a minor role.
Based on our theoretical framework we can now make a prediction on how the two stocks should behave relative one to each other. In the upper graph KBC Ancora would represent point A, and KBC would represent point B. The presumed lower Delta of the higher insolvency risk position (equity of KBC Ancora NV) should outperform the lower insolvency risk position (equity of KBC NV) in bad times because then the negative change of KBC Ancora’s equity is lower due to its lower Delta. Similarly, in good times the equity of KBC should outperform KBC Ancora’s equity because then the positive change of KBC Ancora’s equity is lower due to its lower Delta.
Below we provide an overview of relative stock price developments of KBC Ancora and KBC during the time 2007 to 2015. The first important point is here that on average over time KBC Ancora trades at a discount to KBC. This is due to the aforementioned net negative effects of worse corporate governance and cash flow access which clearly overcompensates the tax shield effect. The second important point is that we measure good-times/bad-times in terms of the relationship of KBC Ancora’s Gross Asset Value (i.e. the market value of KBC shares held) and Net Asset Value (i.e. the market value of KBC shares held minus net debt). The higher this ratio, the more relevant is the debt position and hence the worse the situation is.
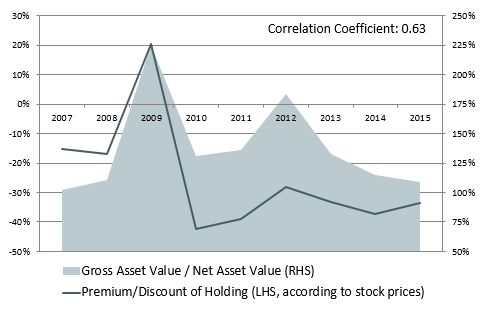
Looking at the graph, we can see that the observations obviously clearly support our theoretical thinking. The relative stock developments of KBC Ancora and KBC are very well in line with what we expected. In times of bad general development KBC Ancora’s discount narrows or even turns into a premium (as has been the case during the financial crisis), and in times of good development it is rather KBC which outperforms. This finding clearly emphasises the relevance of thinking in non-linear, option-like terms when valuing distressed equity – not only in theory but also in practice.
But to be fair once again, this development of KBC Ancora and KBC is still quite synthetic. In reality we do not have these largely unblurred comparison possibilities when valuing distressed equity. The option-like effects are often overshadowed by other value relevant developments, such as the already mentioned topics of indirect insolvency costs, technical discounting effects and so on. But the findings from KBC and KBC Ancora at least highlights how important it is to take this non-linearity effect into account a lot – together with other crisis-related valuation aspects – when valuing distressed equity.