

Sometimes stories are better told short. But not so when it is about IFRS 16, the new standard on lease accounting which basically brings all lease commitments of the lessee onto the balance sheet starting in the financial year 2019 (for more details on IFRS 16, see https://www.iasplus.com/de/standards/ifrs/ifrs-16). In fact, the short story goes like: “Nothing has changed for equity values (from a technical perspective), it is only accounting!” So far, so good. For some investors and analysts, however, it is still quite confusing to understand how this no-change-in-equity-value has an impact on other valuation components such as WACC, enterprise value and the unlevered cost of equity. This is why we better tell this story in a slightly longer way.
Just to make clear at the beginning: This article is only about technical aspects of analysis and valuation. In reality, IFRS 16 has changed a couple of points with regard to equity values – simply because it brought a new set of information to investors: the information of present value calculation per se, more flexible maturity time range disclosure and additional information on complex features of lease contracts (e.g. cancellation and extension options or residual value guarantees). But for reasons of clarity we abstract from these non-technical details below.
The starting point of our analysis is the above told short story: Due to this IFRS-accounting-only-change the equity value remains unchanged. Not even tax effects are recorded. The cash flows to shareholders (Flow-to-Equity) are also untouched. And hence the (levered) cost of equity stays the same, too. No big surprise. In practice this is, however, not super-straightforward. In particular if we use the WACC approach for determining business values. In order to highlight the proceeding in a real world case we use Deutsche Post DHL (DP) – an early adopter of IFRS 16 already in 2018 – as a working example below.
Important: The following numbers are no analytical numbers but just some simplified guesses (though not very far away from our actual guesses). It is not about calculating a fair value of equity, but rather to show the interrelations between the different parameters before and after IFRS 16 here. The main results of this exercise are of course also valid for other estimates of cash flows, values and parameters. But – promised – we will go deeper in some of the aspects of IFRS 16 in one of the next blog articles.
For our example it is assumed that DP DHL generates in 2019 a sustainable, steady-state operating cash flow pre lease payments (but including cash inflows of financial assets) of 6,800 mio Euros, lease payments of 2,000 mio Euros (both after adjusted taxes) and capital expenditures of 2,500 mio Euros. The risk free rate is 1%, the the cost of debt of DP is also assumed to be 1% here for reasons of simplicity (a 1.625% fixed coupon 2028 maturity plain vanilla bond of DP has a yield-to-maturity just below 1% at the time of writing). The market risk premium is set at 7.5%. Net debt ex leasing (and ex financial assets but including long-term provisions) is 9,433 mio Euros at the end of 2018 and the IFRS 16 leasing liability is 9,127 mio Euros. The tax rate is set at 30%. The (levered) equity beta is assumed to be 1,0. We assume the steady state company increases by 2% per year. Leases also grow at 2% per year until eternity (for reasons of simplicity here, i.e they are re-contracted at a 2% growing speed).
In a pre IFRS 16 world, the 2019 Free Cash Flow to the Firm (FCFF) of DP DHL is 6,800 – 2,000 – 2,500 = 2,300 mio Euro. The cost of (levered) equity according to the CAPM is Riskfree rate + levered Beta * Market risk premium = 1% + 1 * 7.5% = 8.5%. Using an iterative process we get for the market value weightings: Equity / Enterprise Value = 79.8%, and for Net Debt / Enterprise Value = 20.2%.
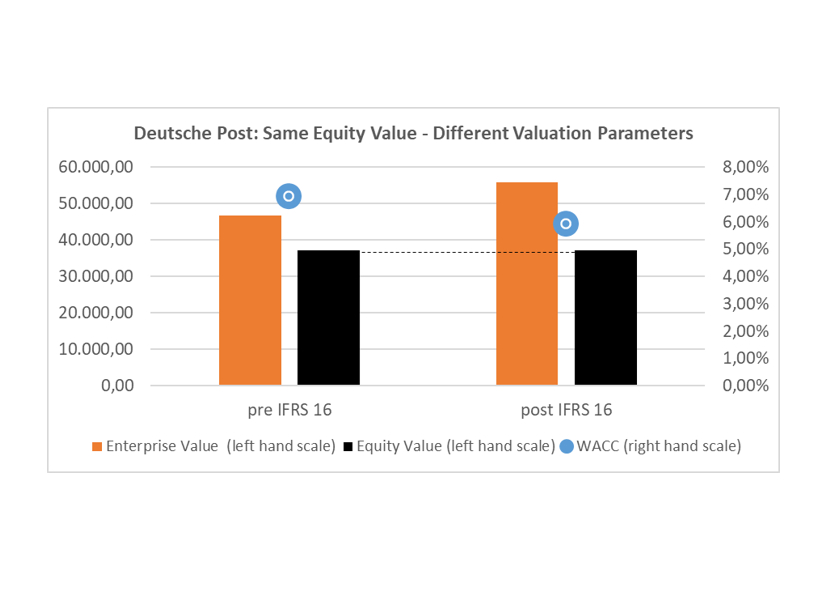
The WACC is hence 8.5% * 79.8% + 1% * 20.2% * (1-0,3) = 6.92. This leads to an end of 2018 Enterprise Value of FCFF / (wacc-g) = 2.300 / (6.92% – 2%) = 46,704 mio Euros. Deducting now the net debt, leads us to an equity value of 46,704 – 9,433 = 37.271 mio Euros (implied value per share ≈ 30 Euros). And just to show that our iteration worked: Dividing the value of equity by the enterprise value is 37,371 / 46,704 = 79.8%. Exactly the value that we included into our WACC calculation.
In a post IFRS 16 world, the 2019 Free Cash Flow to the Firm of DP DHL is lower here. This is due to the fact that FCFF is defined before all transactions with debt capital providers. If we now classify lease payment duties as debt (which have been operating before), we have to add back the interest payments related to the lease liability (cost of debt of 1%* new lease liability 2018) and deduct the steady state increase in the lease liability (growth rate of 2% * new lease liability 2018). Take care: We add back the after-tax interest payments which is strictly speaking wrong (because there are no tax effects attached to IFRS 16), but as leasing payments per se are tax deductible we do not make a consistency mistake. However, I admit that we could refine our model further for the real tax effects, but this would make the explanations here much more complicated (but it would still work). The post IFRS 16 FCFF of 2019 is now 2,300 + 63.89 – 182.54 = 2,181.35 mio Euro. The (levered) cost of equity stays unchanged as IFRS 16 does not have an effect on it. Using again an iterative process we get for the new market value weightings (take care: Net debt is now higher than pre IFRS 16): Equity / Enterprise Value = 66.75%, and accordingly for Net Debt / Enterprise Value = 33.25%. As nothing has changed from an economic point of view it is fair to assume that the cost of debt also stays the same (investors should have taken the liability character of lease payments into account already pre IFRS 16). Accordingly the new WACC is 8.5% * 66.75% + 1% * 33.25% * (1 – 0,3) = 5.91%. This leads to an end of 2018 Enterprise Value of FCFF / (wacc – g) = 2,181.35 / (5.91% – 2%) = 55,831 mio Euros. Deducting now the new total net debt of 9,433 + 9,127 = 18,560 leads us to the equity value of 55,831 – 18,560 = 37,271 mio Euros, the same as in the pre IFRS 16 example. And just to check our iteration works: Dividing the value of equity by the new enterprise value is 37,371 / 55,831 = 66.75%.
Again exactly the value that we included into our WACC calculation.
Result: Exactly the same Equity Values!
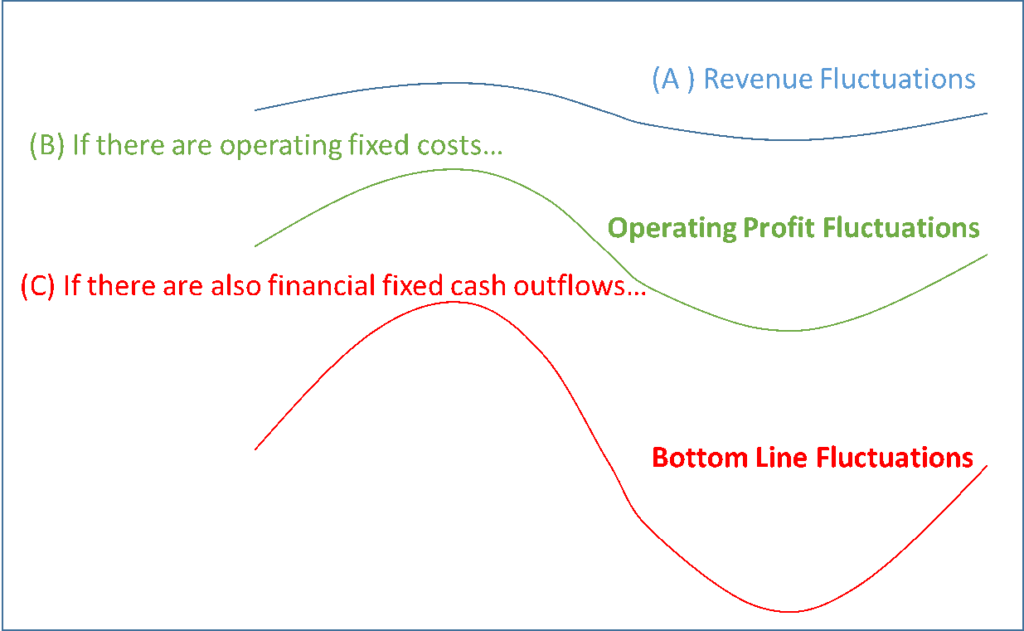
The second step of the analysis is to shed some more light on the drivers of the cost of equity, in particular on the nature of risk. Risk in equity valuation is a combination of three components: (A), the sales risk. It describes the uncertainty (measured as fluctuations or volatility or correlation) of the revenues of a company over time and is the result of typical product market forces. (B), the operating leverage as the amplifier no. 1. Operating leverage describes the fact that the existence of fixed costs in a company translates a given sales risk into a higher EBIT risk. And (C), the financial leverage as the amplifier no. 2. This one translates the EBIT-risk into an even higher net income (or Flow to Equity) risk if the company has fixed debt servicing duties to fulfil. The following graph highlights the three drivers of equity risk.
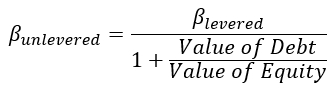
The third step of the analysis is now to compare the risk profile of the operating business of Deutsche Post DHL before and after IFRS 16. We do this by eliminating the capital structure risk from the cost of equity by way of the so called “unlevering” technique. This is a standard process in business valuation e.g. when the CAPM risk factor Beta is transported from a group of comparable companies (peer group) to a target company. A typical, simplified unlevering formula for beta looks as follows (Harris/Pringle, Journal of Financial Research 1985):
Applying this formula to Deutsche Post DHL for both situations leads to an interesting result: The company has different beta unlevered, and hence a different cost of equity unlevered and therefore a different risk profile of the operating business before and after the IFRS 16 implementation. But how is this possible if the company has not changed at all (still it is only accounting!)?
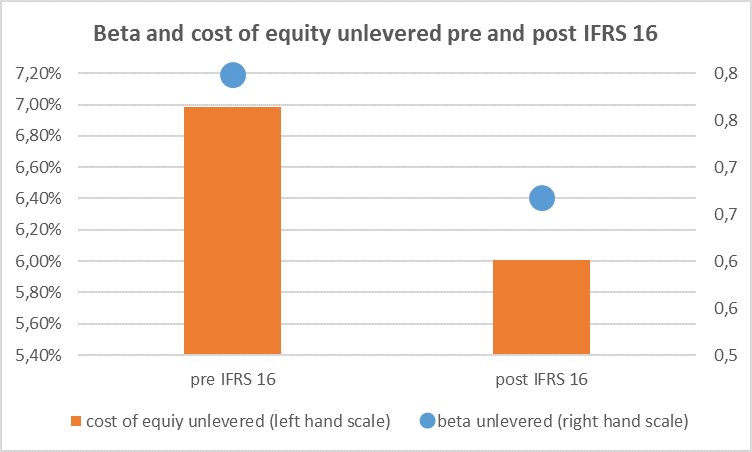
The root to the answer lies in our first two steps of the analysis: If the overall risk profile of the company has not changed (and the sales risk has not changed neither) but the financial risk has changed (due to different financial leverage), then it MUST be the case that the operating (EBIT) risk has changed as well! The company has a lower EBIT-risk and hence a lower operating leverage after the implementation of IFRS 16 than before. This is only possible if the company changed – in the sense of DCF valuation – its set of operating activities.
That this is in fact the case becomes clearer when we look at what happened in the course of the IFRS 16 change: an operating fixed cost component (the operating lease payment) is taken out of the company and a financial cash outflow (interest payment and debt repayment) is added. It is an exchange of two fixed cost items, a substitution of operating leverage with financial leverage. And so the company’s operating business profile has in fact changed – it is obviously a question of perspective!
This is an interesting finding: Not only the scope of operations has changed due to IFRS 16 (operating lease payments now being part of the financial part of DP) but also the risk of operations. It shows how important consistency in business valuation is. For the shareholder nothing has changed (it is really only accounting if we abstracted from any information changes) but we definitely have to take care how we get to this unchanged equity value in practice. If we apply the well-known WACC-approach then a lot of parameters in our model are affected: the WACC itself, the unlevered cost of equity, the net debt and the enterprise value.
For this, the recently implemented accounting standard IFRS 16 delivers a lot of interesting inside into our DCF valuation world. In order to not get lost in this valuation jungle the main lessons learned are summarized below:
- From a technical point IFRS 16 is only accounting, the equity value does not change by its implementation. But from an analytical point of view, IFRS 16 provides some more information on the concrete nature of the lease contracts which was not available before, which in turn might have an impact on the equity value.
- Sticking to the technical aspects only: IFRS 16 exchanges an operating fixed-cost expense into a financial fixed cost cash-outflow. This has an impact on the split and nature of the operating part (after IFRS 16: higher positive value and lower risk contribution) and the financial part (after IFRS 16: higher negative value and higher risk contribution) of the company.
- As a consequence, enterprise value increases as well: Now the group of capital providers that have a take on enterprise value also includes the lessors (which have been not part of the group before). More capital providers means higher enterprise value.
- The implementation of IFRS 16 also highlights that there is no clear single definition of the unlevered firm or better: of the operating activities. It depends on what you want to see as operating. This is not only the case for leasing commitments (here we have indeed a clearer picture on what is operating and what is financial after the IFRS 16 implementation), it is also about the nature of certain at-equity participations, certain provisions or creative supplier financing à la Carillion (see here for the German blog about this case: https://valuesque.com/1-jahr-carillion-pleite-das-recurring-non-recurring-bilanzanalyse-problem/). This is an important finding also for peer group selection as part of valuation using multiples or transferring betas from a set of comparable companies to the target company.
For those of you who do not want to apply a WACC approach but rather stick to other variants of the DCF-model, we provide below also the according calculations before and after IFRS 16 following the equity approach (Flow-to-Equity discounted at the (levered cost of equity) and the Adjusted Present Value Approach (APV) – each for the above DP example.
Appendix
- The steady state Flow-to-Equity 2019 of DP in our example is calculated pre IFRS 16 by deducting the interest payments on net debt ex leasing (after tax) and adding the increase in net debt (pre-leasing) to the Free Cash Flow to the Firm:
Flow-to-Equity = 2,300 – 66.03 + 188.66 = 2,422.63 mio Euros
We now get the value of equity by determining the present value (discounting flow to equity by the (levered) cost of equity, and accounting for growth):
Value of Equity = 2,422.63 / (8.5% – 2%) = 37,271 mio Euros
As nothing changes for shareholders by applying IFRS 16 from a technical point of view, this is also the post IFRS 16 calculation.
- In the APV-Approach the value of the company is split into an operating part and the value of tax shields:
BEFORE IFRS 16: The value of operations is calculated by discounting the Free-Cash-Flow-to-The-Firm with the unlevered cost of equity (and accounting for growth):
Value of operations = 2,300 / (6.99% – 2%) = 46,136,6 mio Euros
The value of tax shields is calculated by discounting the periodical tax shield at the unlevered cost of equity (assumption here: tax shields have the same variation as the unlevered cost of equity, i.e. debt is adjusted to the market value of equity each second so that there remains a constant leverage ratio, a standard assumption in business valuation). The periodical tax shield is here equal to the cost of debt (1%) times the pre-IFRS-16 net debt times (1-tax rate).
Value of tax shields = 28.3 / (6.99% – 2%) = 567,7 mio Euros Adding both gets us to the Enterprise Value of 46,136,6 + 567.7 = 46,704 mio Euros (see above for the same value according to the WACC approach).
The equity value is determined now by deducting the net debt from the enterprise value:
Value of equity = 46,704 – 9,433 = 37,271 mio Euros
AFTER IFRS 16: The value of operations is calculated by discounting the after IFRS 16 Free-Cash-Flow-to-The-Firm with the after IFRS 16 unlevered cost of equity (see above for the numbers):
Value of operations = 2,181.35 / (6.01% – 2%) = 54,441.57 mio Euros
The value of tax shields is calculated again by discounting the periodical tax shield (now including the lease liability) at the unlevered cost of equity. Hence, the periodical tax shield is now equal to the cost of debt (1%) times the post-IFRS-16 net debt times (1-tax rate).
Value of tax shields = 55,68 / (6.01% – 2%) = 1,389.65 mio Euros
Adding both and we get to the Enterprise Value of 54,441.57 + 1,389.65 = 55,831 mio Euros.
The equity value is determined now by deducting the post-IFRS-16 net debt from the enterprise value:
Value of equity = 55,831 – 18,560 = 37,271 mio Euros.