Schneider-Neureither & Partner SE (SNP) is a German software company, mainly active in the field of data transformation solutions. The company often runs bigger development projects which take several months or even years to be finished. It is a classic investment example of where an order book could help a lot to forecast revenues because usually the order intake should translate into revenues sooner or later. However, this would require that the order book is properly kept and is not subject to bigger adjustments over time.
Recently (15 January 2021), SNP released a profit warning stating that despite revenue expectations being met in FY 2020, EBIT will be close to zero due to project delays and an expected contract not realizing. We take this profit warning as an occasion to write about some of our thoughts on SNP in this blog post. However, in contrast to the company we do not have a major problem with the bottom-line, we rather have some reservations regarding the top-line, i.e. the revenues… and for this we have already contacted the company before the profit warning to address our questions.
In fact, SNP is a company that popped up in our accounting screen already quite often. One reason was that the company engaged several times in what we call “opportunistic reporting” if it seemed to be of benefit for the company. Opportunistic reporting is a communication technique that always focusses on the seemingly best wording or best choice of presentation in the reports (thereby hiding some not so good news), in particular in quarterly reports.
In the SNP business orders flow-in each quarter – sometimes more, sometimes less. The company regularly communicates the order intakes in its quarterly reports. In the first quarter of every financial year, it is clear that the company communicates the quarterly intake. And in the annual report (i.e. the Q4-reporting) the company naturally communicates the cumulative annual intake. So far nothing unusual. However, in Q2 and Q3 of each year the company has some sort of a choice: Should it communicate the cumulative order intake (i.e. H1-intake for Q1+Q2 together, or the three quarter intake for Q1+Q2+Q3 together) or should it communicate the single quarter intake (i.e. Q2 only in the Q2-report, or Q3 only in the Q3 report). Of course, with some research every analyst can translate one way of reporting into the other way of reporting, no information gets really lost. But it needs some active analysis to do that. And why not showing rather the better picture if there is a choice…
Below we have mapped SNP’s quarterly order intake since Q1/2017 as well as the respective cumulative values for each financial year. We have also shown in the figure whether the Q2 and Q3 numbers were higher or lower than the comparable numbers (last quarter for quarterly intake or last year’s H1- respectively Q1-Q3 for cumulative intake).
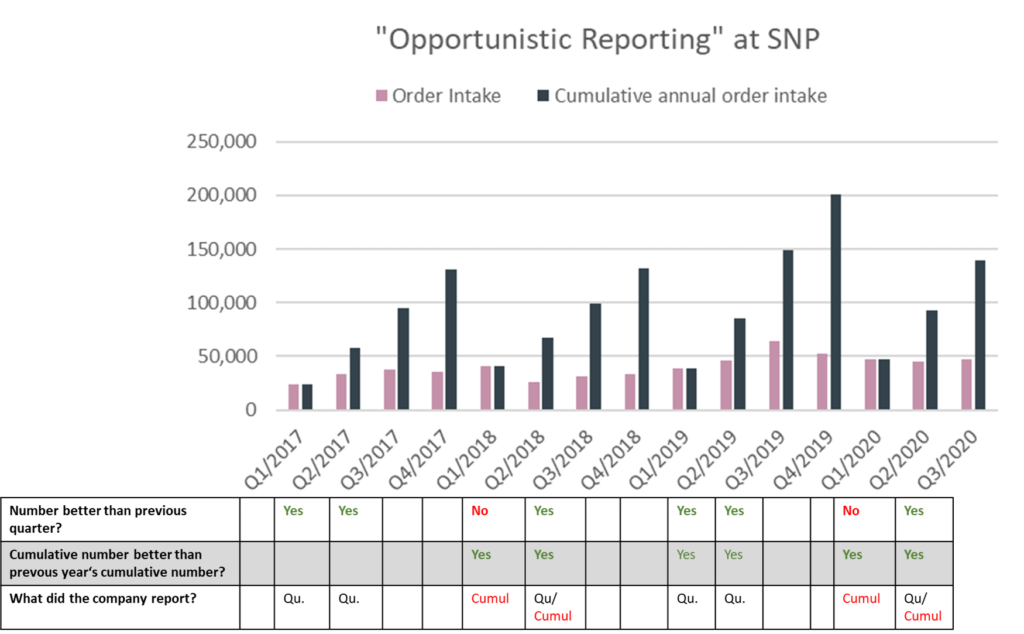
In the figure we also show which style of communication SNP has chosen. And this is quite an interesting finding. In its Q2-reporting of each financial year the company has opted for the seemingly best looking way of communication – no matter what consistency rules dictate. If the Q-on-Q change was positive the company chose the natural way of (at least also) reporting the quarterly intake as compared to the quarter before. If, however, the Q-on-Q change was negative, the company reported only the seemingly better sounding cumulative half year figures as compared to last year’s cumulative half year figures (where the difference was positive in both years 2018 and 2020). In Q3 then, the company provided the full information again. The respective wording of the Q2-reports can be found in the appendix of this blog post. To be fair: This is not a big problem as no information is really hidden, but for us it is already a sign of which sort of governance the company follows.
A second reason for the alert in our accounting screen was the steadily increasing position of so called “Contract Assets” in recent quarters. Contract assets relate to work performed on a contract that has not yet translated into billable revenue. Its explicit mentioning in the balance sheet is a consequence of IFRS 15 Revenue Recognition and the accompanying end of the so called percentage-of-completion (POC) accounting (IAS 11). In its 2018 reporting, SNP explains in this context:
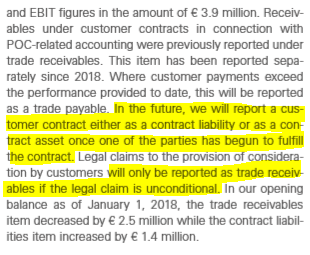
Source: SNP H1/18 Report, p. 24.
Since 2019 the position of net contract assets (i.e. contract assets minus contract liabilities) has increased quite strongly.
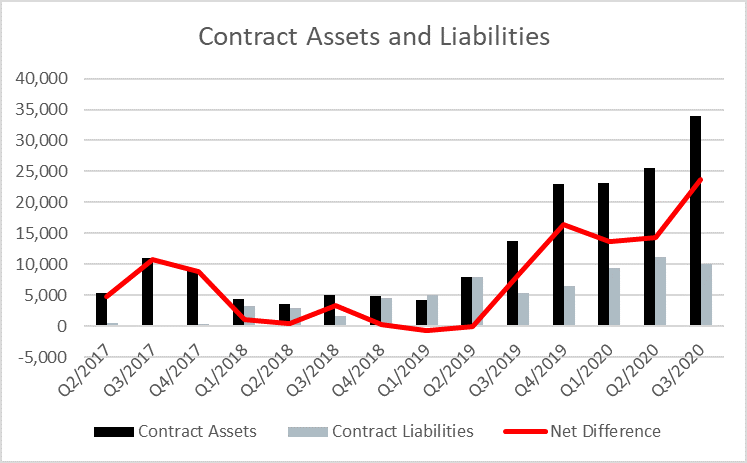
The company told us that this increase in contract assets is mainly due to a larger contract that was signed in August 2019 and is running for 3 years (since inception). So what is happening here is that SNP brings own work performed on this contract onto the balance sheet and – at least so far – keeps it away from the P&L. The work does not yet qualify as revenues because otherwise it would be treated as a receivable. This is not wrong per se but for investors it is important to clearly understand what this information tells us.
Under IFRS 15 revenues of longer term projects can no longer be as easily recognised period-by-period as it was possible under the old IAS 11 (POC-Accounting). However, it is still possible. For doing this either the customer takes control of (at least parts of) the project during the project time or the company has a legal claim to get paid for the work performed so far. In the case of SNP’s relevant contract, obviously the conditions for recognising revenue during the project period are not met. I.e. even if there is a minimum take agreement in the contract (the company told us that it is 30 mio USD) so far SNP is not able to claim any payment for what they have done in the past. It seems as if they have to finish the project until they get paid for it. This again tells us a lot about the riskiness of the contract: it needs to spend more cots until SNP is entitled to revenues. Will it reach maturity state and be ready for revenue recognition in the future? Probably, but I do not know. Will these costs be covered in the future? Unclear, as I do not know the contract details (but a 30 mio USD minimum take clause does not look like a free lunch as compared to a Q3/20 net contract asset position of ca. 24 mio Euro and a USD/Euro 1.20 rate). Who is taking which risk in this contract? I do not know exactly. What about cash flows? Deep in the negative so far….
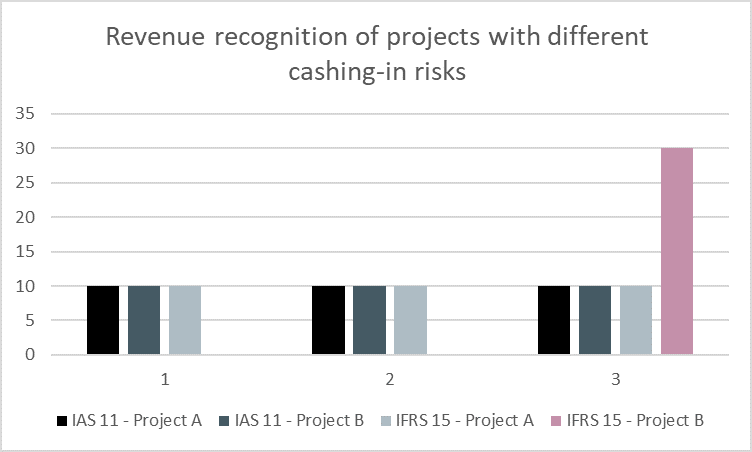
So, the least that I want to say here is that it is difficult to assess the quality of this contract. But the good news is that we know that it is difficult to assess because the company cannot yet recognise revenues. It is one of the benefits of IFRS 15 that we can better understand the riskiness of contracts than before. In the old IAS 11 environment we would not have seen any differences between contracts that allow to claim payment earlier and those that only allow for payment for the finished project – for both we would have applied POC accounting. The following graph highlights this for a 3 year period for project A (early milestones and payment claims, lower risk) and project B (payment only for the finished project, higher risk). You can see that the fact that revenues can only be recognised at the end of the project tells us now under IFRS 15 a lot about its structure and riskiness.
The third reason for giving the alert of our accounting screen relates to the order book of SNP. Usually, the order book, the order intake and the revenue generation are linked by a clear relationship:
Or in words, the current order book equals the previous order book plus current intake minus what was transformed into revenues. Admittedly, the new order book might be understated a bit by this equation simply because there might be revenues which do not flow through the order book, i.e. some intra-quarter order-to-revenue transformation or some revenue which does not find its way to order book anyway (certain services).
However, if we look at the order book development of SNP over the last quarters we can spot something completely different.
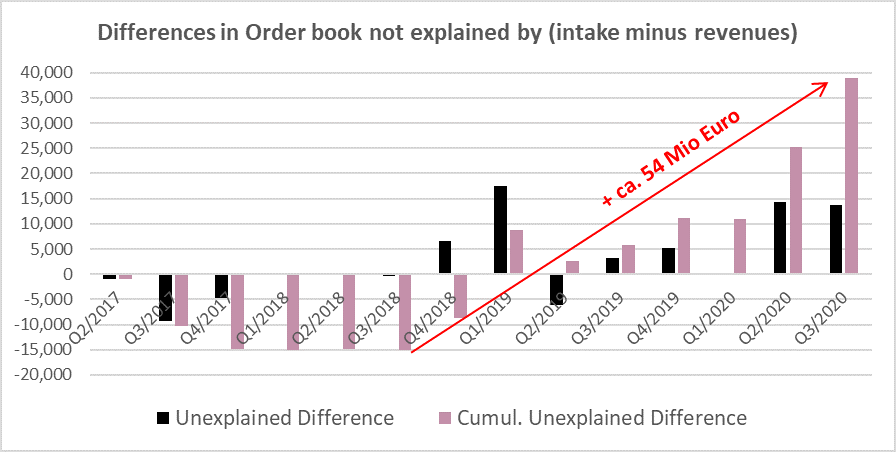
While some quarters in fact show a negative new order book deviation, most quarters show a POSITIVE order book deviation. I.e. the stated order book was HIGHER than one would expect based on the equation above. The differences were quite massive in some quarters, and between Q4/2018 and Q3/2020 the cumulative difference added up to more than 54 Mio Euros (!). To explain this in words: On average the order book has increased by far more than the order intake minus the revenues would suggest.
There are several explanations to this: First, there were massive order cancelations in place, i.e. customers have withdrawn their orders and this is not recognised as a negative order intake. However, the company explained to us that cancellations do only rarely and not meaningfully take place. Second, there are some calculation problems with order intakes and books. Here, the company admitted to us that there have been some minor problems in the past with Latin American subsidiaries but they have now been solved. Moreover, looking at the portion of Latin American revenues (roughly 10% of total), this could not be the real explanation. Third, the order intake numbers are premature, e.g. by being counted as an order already before it is a contractual order but perhaps only a customer inquiry (and hence where these ‘orders’ partly do not translate into real contractual orders despite being booked as such). However, the company explained to us it needs a signed contract to enter the order book. Forth, it could be that the company bloats the order numbers, i.e by setting the contract value too high initially (assuming too many billable hours) only to end up at a smaller revenue number in the end. Whatever it is: There is some revenue missing in our models!
But let’s look a bit deeper into the order management. On average over the period Q1/2017 to Q3/2020 the quarterly intake-to-book ratio stands at 56%. This suggests that a typical average project takes two quarters to be translated into revenues (the fact that the ratio is a bit higher than 50% can be explained by a growing company). So the revenues on average should match the order intake with a two-period lag (to be clear the revenues should be higher because of the above mentioned revenues which perhaps do not flow through the order book). Below we have taken the cumulative 4-period intake numbers and compared them to the lagged (1Q-lag, 2Q-lag, etc.) cumulative 4-period-revenue numbers. The result is again surprising. In particular since Q4/2018 revenues massively fall short of intake numbers (even for longer than 2-period lags). Over the whole Q1/2017 to Q3/2020 period the average lagged book-to-bill ratios are higher than 1 – even for a 4-period lag. So, where are the revenues? Do they come far later because the newer projects take much longer – and really much longer than in the past (but this would still not explain the order book mismatch described above)? Or – again a possible explanation – are order entries bloated as compared to their future revenue generation potential?
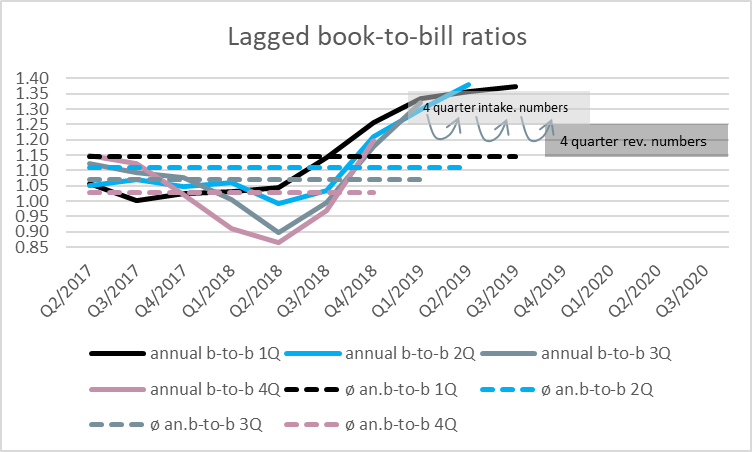
Explanation to the figure (example: 3-Q-lagged book-to-bill [b-to-b] ratio): the data points show the starting date of the 4-period cumulative order intake, and they are compared to the 3-Q-lagged 4-period-cumulative revenue numbers; hence, the data point Q1/2019 compares Q1-Q4 cumulative intake with Q4/2019-Q3-2020 cumulative revenue. So, all the revenue data points until Q3/2020 are taken into account even if the data points indicate an earlier date (reason: time lag and cumulating period).
We do not know what the exact explanation is for the phenomena discussed in this blog post. They all relate to some sort of revenue number uncertainties in the context of longer-term projects. Admittedly, we have some preferences for certain explanations but we want to leave it up to the reader to make up his/her own mind. Anyway, two things are worth highlighting at the end: First, while IFRS 15 is often bashed for being too complex or not providing a gain of information, the current case shows the opposite. Here, IFRS 15 allowed to better assess the riskiness (or uncertainty) of some balance sheet transactions. And second, the order book can be both, friend or foe. While often delivering important information regarding future revenues, it needs to be properly and transparently kept in order to function.
Disclaimer:
We hold no economic stake in SNP – in whatsoever direction. We base our analysis on imperfect information and hence we might be wrong with some conclusions. This is just our subjective view and no investment recommendation at all! Please do your own Research!
Appendix
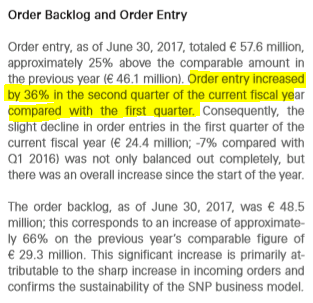
Source: SNP H1/17 Report, p. 20.
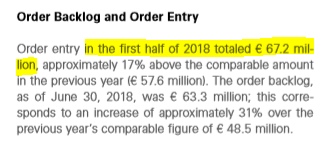
Source: SNP H1/18 Report, p. 12.
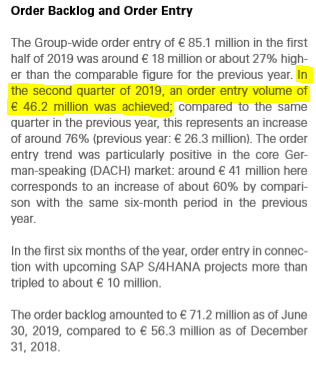
Source: SNP H1/19 Report, p. 14.
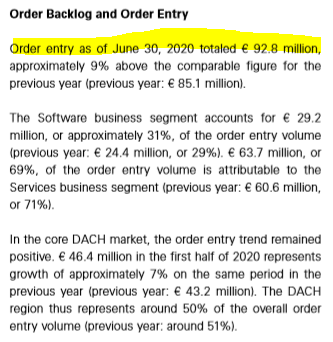
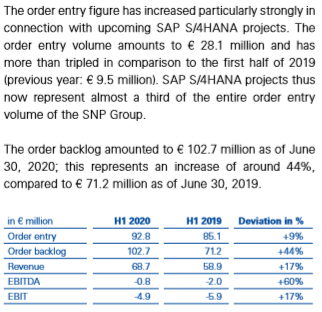
Source: SNP H1/20 Report, p. 12.