As a consequence of the experiences made during the great financial crisis 2008/09 the IASB changed financial instruments accounting away from the incurred loan losses approach to a forward looking expected loan losses approach. Concretely, the new IFRS 9 Financial Instruments applies a 3-stage model which requires to classify loans into performing, under-performing or non-performing based on observations of credit risk movements. Each of these three stages triggers different levels of reserves (balance sheet allowances, provisions). The following graph highlights this (we have already shed some light on this topic in one of our former blog posts where we have explained the general functioning of the new standard (HERE); please refer to this post for an understanding of the IFRS 9 system in general).
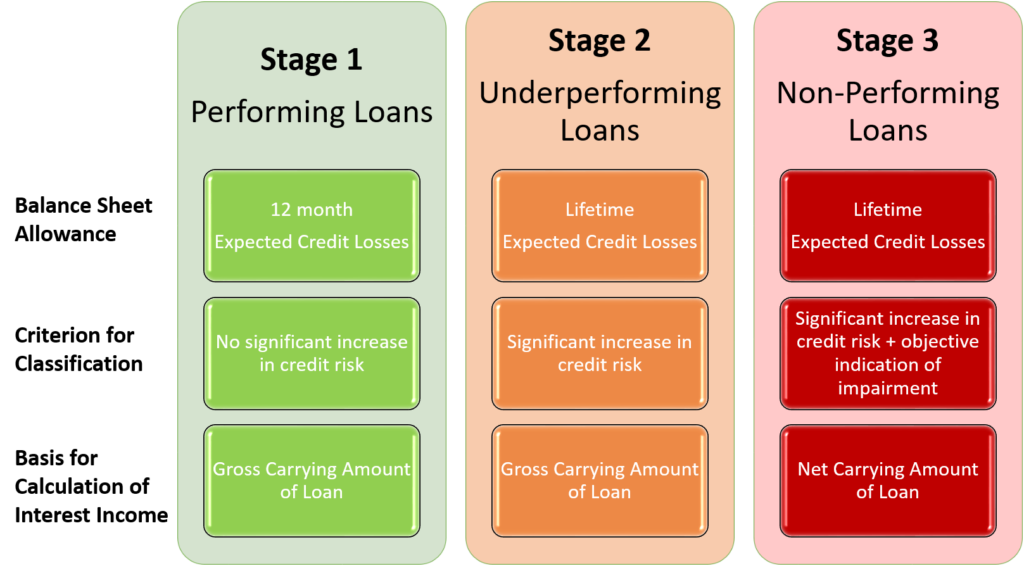
* In practice the liftetime losses are proxied by a 3 year forward looking analytical horizon.
This makes sense in principal as it is the future, i.e. the expected losses that matter for decision making for banks. But as always when we talk about the future the input to our decision making tools becomes more and more blurred. In terms of financial instrument accounting this means: While incurred losses of loans were easy to determine based on actual data points, forward looking expectations always need subjective inputs. It is the old dilemma of accounting in general, and IFRS and US-GAAP accounting in particular: If you want to have more relevance of reporting you have to give away some degrees of reliability of it. Or putting it differently, while the strengths of the good old local GAAPs (e.g. German GAAP) was that numbers were highly reliable their weakness was that it was not always a good set of numbers to base decisions on. And for IFRS and US-GAAP it is the other way round: Their strengths is the focus on relevant information but at the cost of less reliable or more subjective information.
The academic world still fights today about how this tension field can be solved, with some saying that less reliable information cannot be more relevant (exactly because of the lack of reliability) and others stating that decision-useful information must be highly forward looking because that is the only thing that matters in business valuations (only future cash flows matter). The truth is, however, somewhere between the extremes. Of course, investors want to be able to build forward looking expectations based on the set of accounting information, but they also do not want to give too much forward looking power and hence discretion into the hands of companies’ management because this would open the door for manipulation. In short, there is an optimum – but this optimum is hard to find in reality!
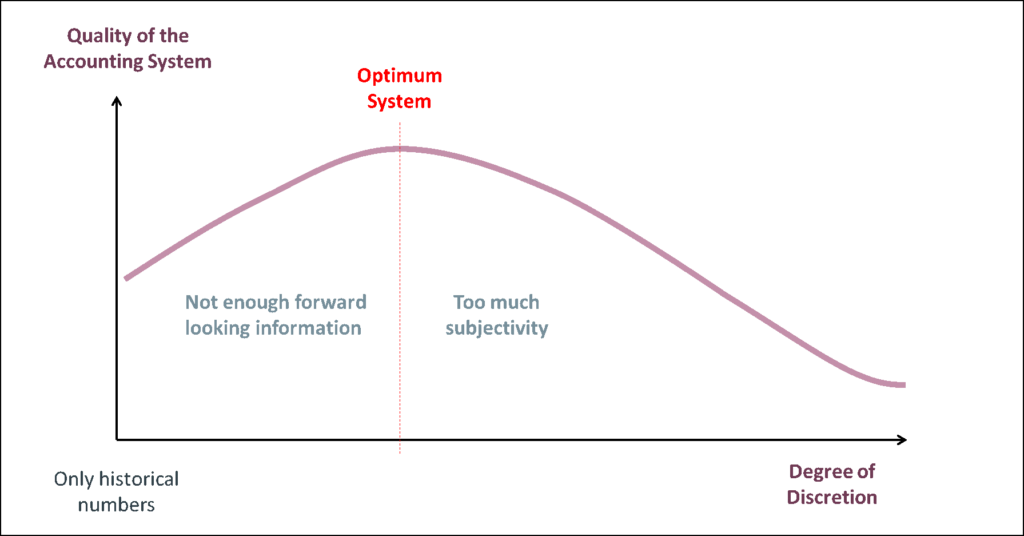
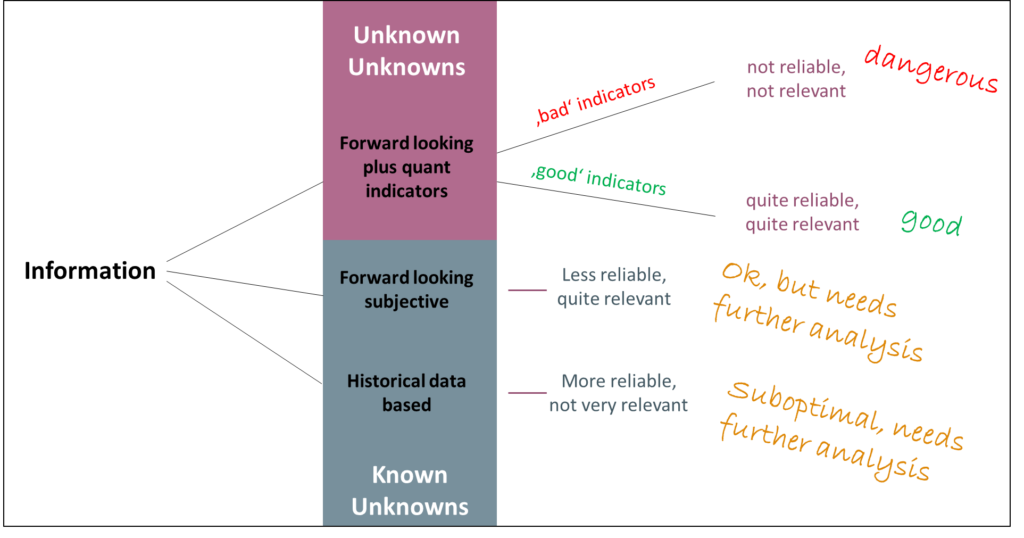
A seemingly logical way of dealing with this problem is to include more ‘hard’ benchmarks or guidelines or indicators into the expectations-building process. This can take out some subjectivity by contemporaneously allowing for a forward looking nature of information. And this is a clear trend to be observed in accounting practice over the last years.
While we applaud this trend in general we also have to emphasize that there are certain situations where this way of dealing with forward looking information brings a lot of problems. It might be that the indicators or benchmarks are bad in general (often the case in goodwill impairment tests) or that the indicators or benchmarks are bad in certain extreme situations (very often the case in every extreme situation). And it is this latter case that makes our accounting often quite vulnerable because investors are quite ok with accounting information in normal situations – the need for high quality information is relatively low if all develops in normal paths – but they desperately need high-quality information in tricky times. This accounting problem is like an airbag in a car that works well all the time except for when you have an accident.
Moreover, if the indicators do not work properly in these extreme times then investors run into a very dangerous ‘Unknown Unknowns’ situation, i.e. they even do not know that something is wrong with the information (in contrast to a pure ‘Known Unknowns’ situation where investors know that the information has some weaknesses).
We want to shed more light on this tricky general problem of accounting by having a closer look at Q3 reporting of Dutch bank ING Group N.V. In particular, we want to analyse its IFRS 9 treatment of loan exposure.
In order to deal with the assessment of expected losses mainly for stages 1 and 2, many banks rely on some indicators which should show on a macro- (e.g. GDP development) and micro- (individual debtor healthiness) basis whether the default-probability assessment of loans has changed. If it got worse from one period to the other then further provisions have to be built-up, if it got better then some of the provisions might be released. This all flows through the ‘cost of risk’ in the profit and loss statement.
With Q1/2020 still a bit of a surprise for many banks it was particularly Q2/2020 which showed the big provision building for coronavirus-induced problems in expected collectability. Just staying on a macro-level, if banks apply a 3-year forward looking indicator assessment (normal short-cut to the ‘lifetime’ assessment) then lots of the macro-indicators got worse in Q2/2020 for the next three years, triggering automatically a reassessment of much of the loan exposure. Of course, indicators did not go down en-bloque for the whole 3-year period but they followed a path back to more or less normality in three years. The following is a very simplified depiction of the change in macro indicators in banks’ risk models (not over 3 year, just a couple of quarters in the graph, and assuming that Q1/2020 was still sleeping [which it was not in every case]).
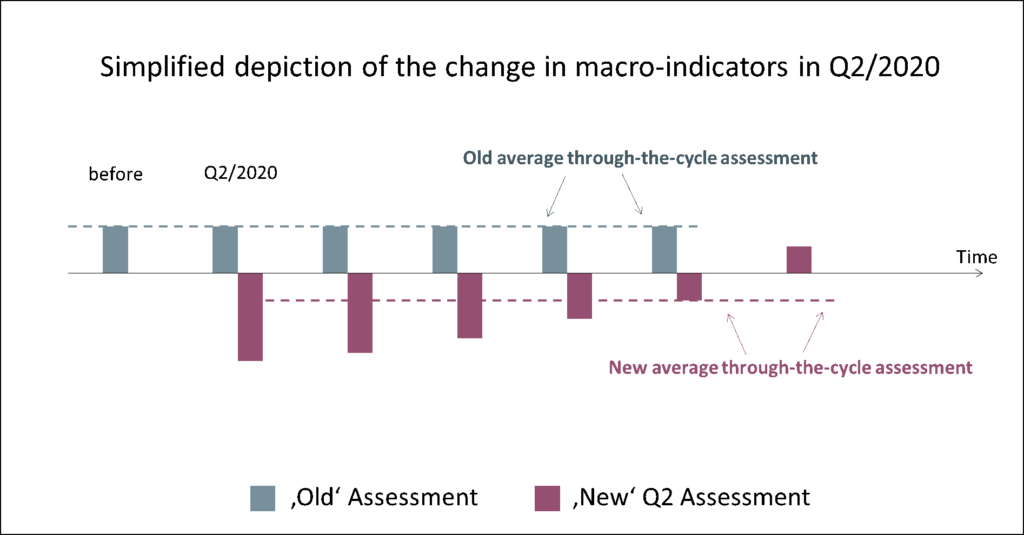
What we can see is a change in indicators with some trend towards normality in the more future quarters – a quite reasonable forecast. Now for Q3/2020 reporting indicators were updated. Even if some of the indicators have even worsened as compared to Q2 what is important now is that over the whole 3-year period the average assessment has improved – simply because the models took out one horrible quarter (forecast for Q3/2020) and substituted it with a quite normal quarter (the new Q3/2023 which was not part of the 3-year forecast period before): the average assessment over the cycle got better (see the new dotted red line)! And this was the result in basically all banks risk models.
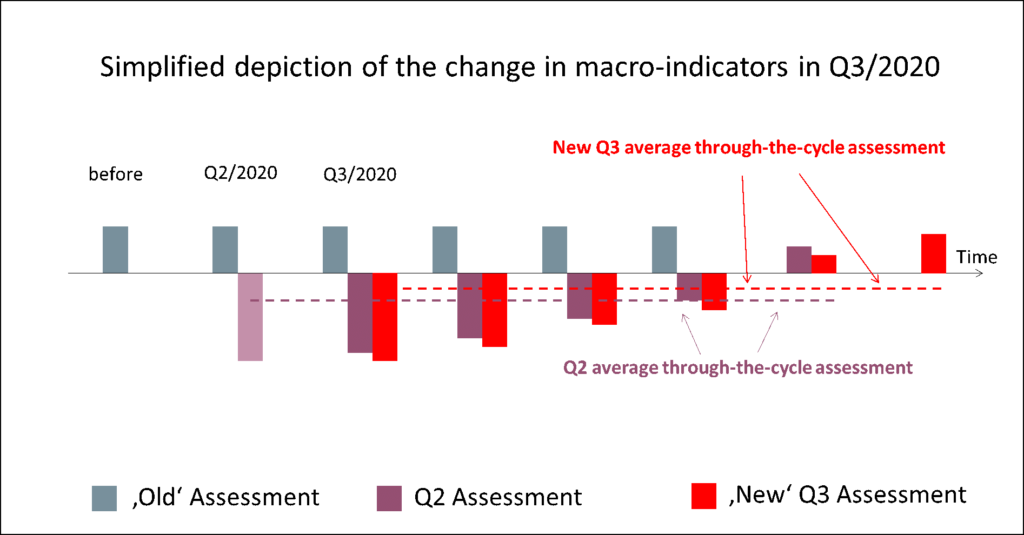
With this improved situation the models now would trigger a release of provisions, i.e. a negative cost of risk in Q3/2020. But a release of provisions does certainly not mirror economic reality very accurately for two reasons: First, the situation in Q3 actually got worse than initially expected, most of the macro indicators worsened for the same target points in time. And second, defaults simply did not yet take place in Europe because they are happening in a delayed way. Debtors across all countries can postpone potential defaults because they benefit from national fiscal relief packages, from payment holidays, from government-supported and -guaranteed loans, or from public fixed cost support schemes (such as e.g. short-term work schemes). The consequence of these effects is that the current situation of stage 1 and stage 2 loans cannot simply be assessed based on 3-year-rolling macro-indicator-based models. It needs more to get to a proper expected loss assessment. It needs some fundamental overlay – and this brings us back to ING.
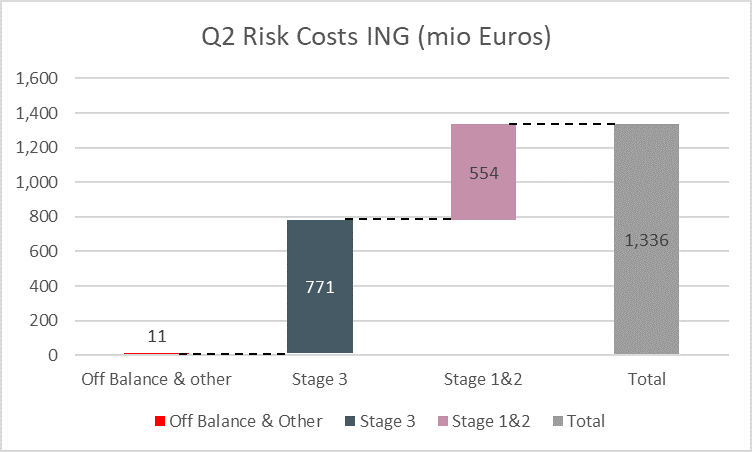
ING had to do a quite massive provisioning for risk in Q2. The bank provided for 1,336 mio Euros or 85 basis points of average customer landing (this compares to a long-time average of about 25 basis points provisioning). The main provisions related to the stage 3 category.
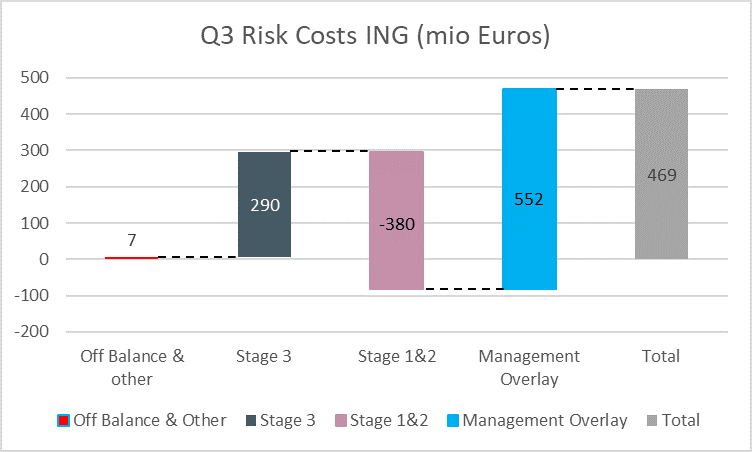
In Q3/2020, stage 3 provisions were clearly below the high Q2/2020 numbers. In fact, new stage 3 provisions (290 mio Euros) mainly related to additions to already existing stage 3 files. Stage 1&2 provisions, however, should not take place – at least according to the models. The improved 3-year forward-looking macro-indicator-based situation triggered a release of provisions amounting to 380 mio Euros. Hence, according to the models ING should have done a net release of provisions (i.e. a risk gain) of about 90 mio Euros or 6 basis points of average customer lending. And this in the middle of the worsening coronavirus crisis with delayed customer defaults!
ING management reacted and applied a 552 mio Euro overlay booking to this situation based on own fundamental analysis. This finally led to a Q3/2020 provisioning of 469 mio Euros or 30 bps of average customer lending.
While this seems to be a reasonable approach in our eyes the appropriateness of the concrete amount of overlay is really hard to retrace. This becomes obvious when looking at other European banks’ behaviour in Q3/2020. Nordea released 2 mio Euros of stage 1+2+3 provisions. Danske Bank performed some overlay but just enough to net out the triggered provision releases and to end up at a zero-number. Deutsche Bank also did a bit of overlay but only to soften the stage 1 & 2 effects. And so on.
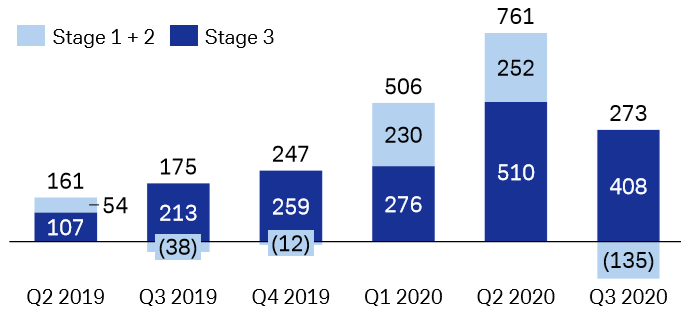
Source: Deutsche Bank Q3/2020 analyst presentation, p. 9.
And so we got a hodgepodge of totally different approaches to assess credit risk in Q3/2020 with comparability nearly impossible and a high degree of subjectivity in the different assessments. For outsiders it is almost impossible to understand the appropriateness of the numbers in single cases. And this was exactly what the IASB did not want to have. It remains to be seen whether banks find a way of better dealing with this opaque situation until the end of the financial year. We are, however, sceptical on this.
Disclaimer: We hold no economic stake in any of the banks mentioned in this report – in whatsoever direction. We base our analysis on imperfect information and hence we might be wrong with some conclusions. This is just our subjective view and no investment recommendation at all!