

Financial statement analysis is an essential skill for anyone working seriously with business valuation. Whether the assignment concerns investment decisions, fairness opinions or expert valuation reports, a thorough understanding of the company’s accounts is fundamental. Today, however, reading the numbers alone is not enough. Analysts must also examine what lies behind them. In this occasional series, we explore some of the challenges of modern financial statement analysis.
Exactly one year ago today, on 15 January 2018, Carillion Plc became insolvent. In 2016, with revenue of GBP 4.4 billion, it had still been the UK’s second-largest construction and services group after Balfour Beatty. Its collapse was one of the country’s largest corporate failures and a textbook example of the difficulty financial reporting and its users face in distinguishing recurring from non-recurring transactions.
This touches on a fundamental IFRS principle: relevance. Financial statements should enable users to draw meaningful conclusions about a company’s future development. Current earnings need not be representative of future earnings, but the income statement, balance sheet, cash flow statement and notes, considered together, should support useful forecasting. In particular, valuers and equity analysts should be able to assess whether transactions have sustainable, recurring effects or are primarily temporary or one-off.
Accounting training provides rules of thumb for classifying transactions. The main distinction is that benefits generated by assets and the periodic costs of providing those benefits generally belong to the recurring sphere. This is also the principle underlying the income statement. Accrual accounting therefore needs to allocate the benefits and costs of multiyear effects appropriately, including long-lived machinery, delayed payments and major projects. Breaking down and anticipating such events necessarily gives management choices and judgement in preparing the accounts.
Some transactions outside the income statement also recur, including replacement capital expenditure and the revolving nature of trade receivables, trade payables and warranty payments. By contrast, transactions that materially change net assets or liabilities in ways not explained by the company’s growth trajectory are generally non-recurring.
The less clear the sustainable nature of reported earnings, the more analysts must draw on other parts of the financial statements. Comparing cash flows with accounting profits is useful, for example through the cash conversion ratio, cash flow divided by profit. A persistent, substantial deviation from 100% can indicate that income statement figures are not sustainable. Empirical support can be found in Allen, Larson and Sloan (2013), Journal of Accounting and Economics. Broadly, a ratio well below 100% tends to signal adverse future earnings developments, and vice versa.
Cash conversion analysis was particularly appropriate for Carillion because its multiyear projects involved substantial management estimates under the then-applicable IAS 11. Greater discretion calls for a more thorough assessment of recurring performance. Carillion’s own management also presented cash conversion as an important indicator.
Examining Carillion’s figures through 2016 shows both how management obscured the approaching crisis and how experienced readers could identify the warning signs. The cut-off is deliberate. When the 2016 annual report was published, management still portrayed the company as healthy. The report carried the corporate slogan ‘Making Tomorrow a Better Place’, and the auditors issued an unqualified opinion.
The income statement first shows a steady deterioration in operating profits and margins from 2014 onwards. On its own, that does not necessarily indicate an existential threat.
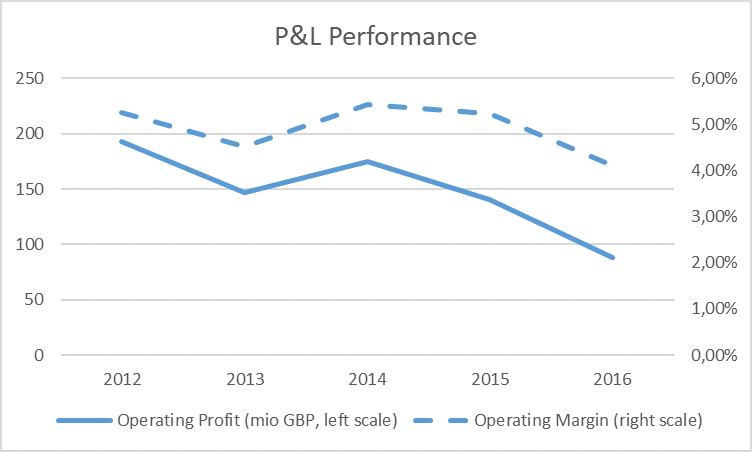
Trade receivables reveal further problems with project cash collection. Outstanding receivables increased materially, indicating that customer cash receipts were falling progressively further behind reported profits. Considering earnings and receivables together, with receivables expressed as days outstanding, makes the situation look considerably more fragile.
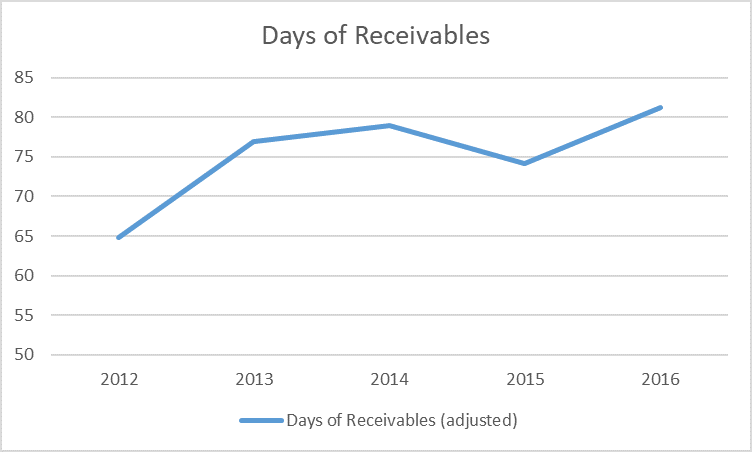
Carillion said little about this in its accounts. Instead, it skilfully redirected attention from receivables to total operating cash flow. Sustainable cash cannot easily be conjured up, but temporary cash inflows can be generated and presented as though they were recurring.
From 2013, Carillion used reverse factoring, a technique that had become increasingly popular. In simplified terms, it obtained longer payment terms from suppliers and compensated them by arranging early payment through a bank. Suppliers received payment on their normal timetable, now from the bank. Carillion delayed its own cash outflow while incurring a new obligation to the bank.
This financing effect, which Carillion also presented as operating in nature, temporarily offset weak customer cash collection. Ordinarily, changing supplier payment arrangements would create a one-off cash benefit lasting a single period. Carillion, however, followed a familiar window-dressing technique: spread a positive one-off effect over several periods so that it appears recurring. It introduced a little reverse factoring, then more in the next period, and more again. Until 2016, expanding the programme offset the cash shortfall from customers each year. Cash conversion based on Carillion’s reported figures therefore continued to look healthy, particularly after operating profits began weakening in 2014.
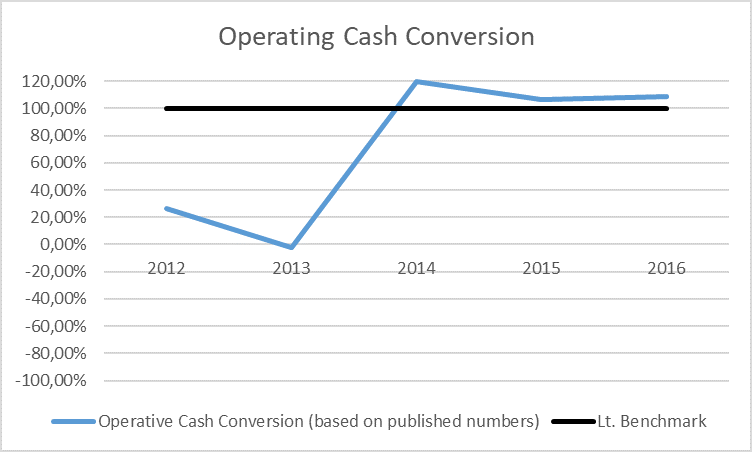
Closer examination shows how much cash generation came from reverse factoring and how that contribution developed over time, again expressed in days. Some figures are estimated because reverse factoring was included within ‘other creditors’ rather than separately disclosed. Changes over time nevertheless allow a reasonably reliable estimate.
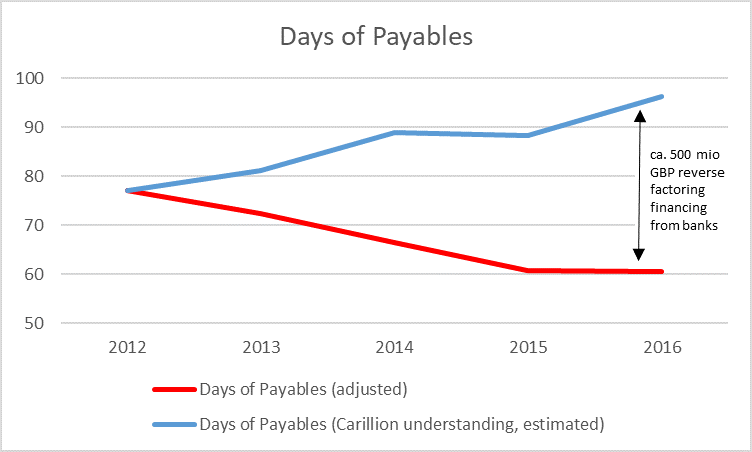
This support could not continue indefinitely. The positive cash effect of reverse factoring had to end because the associated liability could not grow without limit. At the latest, the benefit would disappear once every supplier had been brought into the programme, and in practice the limit would arrive much sooner. These cash flows could not sustainably compensate for weakness in the core business. Cash conversion therefore needed to be analysed without them. Doing so finally revealed the full extent of Carillion’s financial difficulties.
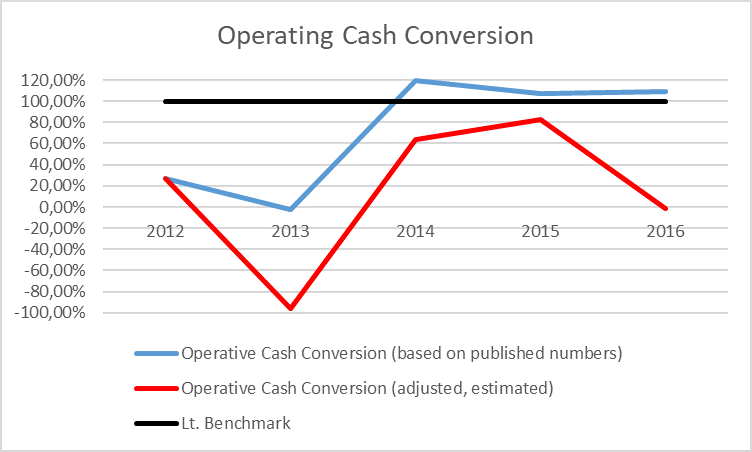
Underlying operating cash conversion, shown in red, was far below the reported or superficially apparent figure in blue, and well below 100%. In 2016, the core operations generated no cash at all.
By the 2016 reporting date, Carillion showed clear weakness in new business, severe problems collecting cash from existing operations and apparently little ability to reverse the trend. Adding other factors, including goodwill exceeding twice the value of equity, which the auditors had not yet required to be impaired, and adjusted net debt of more than six times EBITDA, should already have raised serious doubts about its ability to continue as a going concern when the 2016 annual report was published.
Carillion’s presentation nevertheless appears to have passed most investors’ quantitative accounting screens even in 2016. Its share price weakened, partly reflecting hedge fund activity, but the major sell-off began only when the 2017 half-year results disclosed the full scale of the problems.
Carillion was not unique. Abengoa followed a similar path into insolvency in 2015. These accounting techniques are common, although they do not usually lead directly to scandal. Equity analysts and business valuers should draw three lessons from Carillion’s collapse:
- A liability is a liability. Classifying an item as operating or financing matters for initial analysis and understanding the business, but not for the overall economic position. Until recently, classifying leases as operating or financing affected their accounting treatment without directly changing the underlying analysis, apart from differences in available information. IFRS 16 will largely remove those accounting and disclosure differences.
- What matters is whether cash flows arising from changes in a liability are recurring. Non-recurring effects may generate cash while the liability builds up, but they do not provide lasting support. Operating liabilities often generate more sustainable cash flows because they revolve regularly, but ‘often’ does not mean ‘always’. Classification alone is insufficient. Each case requires analysis.
- Beware of one-off effects spread over several periods. Even where positive one-off effects are economically and accounting-wise justified, CFOs may stretch them out. Here, the disguise was effective: positive cash effects were built up gradually and appeared recurring. An item appearing for four or five consecutive periods is not necessarily sustainable. Again, individual analysis is essential.
Supporters of IFRS 15, the new revenue recognition standard intended to reduce subjectivity and help prevent such developments, have some reason for optimism. But not unlimited optimism. IFRS 15 has shortcomings too, which a future article will discuss.