

The last months have seen a couple of new kids in “pension valuation” town (in terms of ideas, not of personality, they are all old stagers of course)! UBS Accounting man Geoff Robinson suggested to value pension deficits as the present value of making away the underfunding. Companies such as BAE Systems recommend investors more and more into „actuarial funding valuations“ with a discount rate focus on the risk of the plan assets. And the guys from TheFootnotesAnalyst Dennis Jullens and Steve Cooper (who by the way do a great job and provide very interesting articles on their website) expressed their support for sticking to the IFRS accounting valuation way. Lots of ideas on this highly delicate topic with still so many companies out there which carry material pension liabilities respectively deficits on their books. Enough reasons to have a closer look at what matters in pension valuation – at the Dos and the Don’ts. A short story in eight chapters.
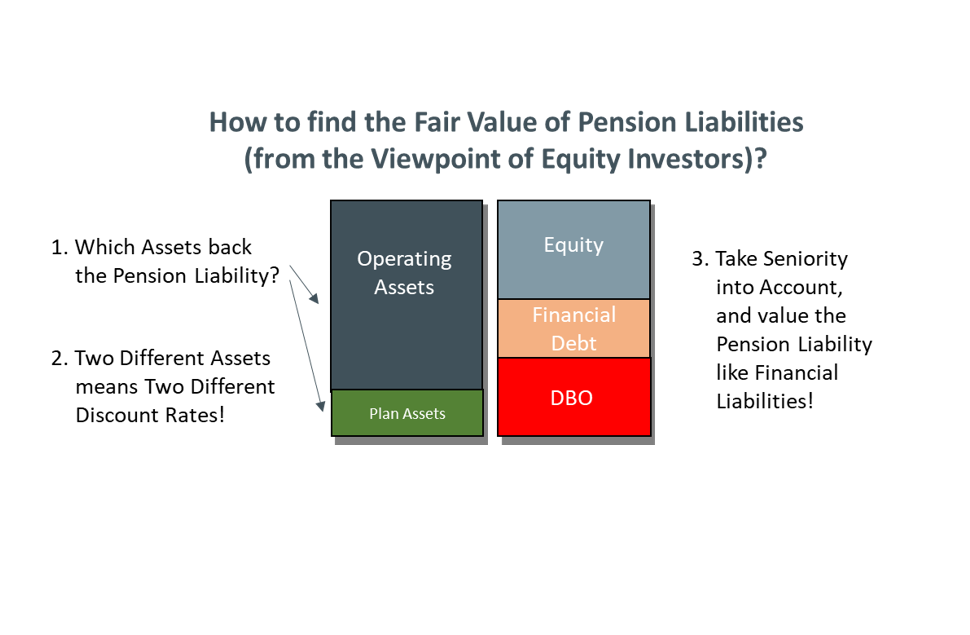
1. The value of a pension liability is determined by the assets that back it
Fundamental to valuation are two aspects: First, a pension liability is usually asymmetric as a whole. This means, it might be paid in full, it might be underpaid if the obligor is in trouble, but it will not be overpaid if the obligor performs better than expected. However, what is true for the total liability might not be true for parts of it – as we will see later. Second, the probability of whether it will be paid in full or underpaid is determined by the nature and characteristics of the assets that back the liability. This is not a very special case, it basically applies to the most part of other liabilities. Attention: „is determined“ does NOT mean that the risk profile of the assets equals the risk profile of the liability. Not at all! It simply means, there is a clear relationship. A very elegant model to put this relationship into a value number is the Merton (1974) model. This model understands the different capital positions (equity and debt) as what they are from a financial point of view: asymmetric option-style positions. It is not a big surprise that this model was the precursor of modern option pricing models à la Black/Scholes. The graph highlights the functioning of the model: The higher the risk (volatility) of the asset side the bigger the probability that the asset value (enterprise value) falls short of the liability at the due date. 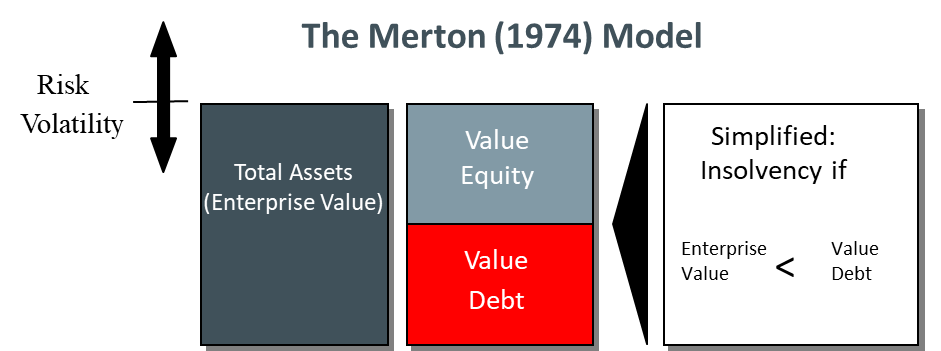
2. There are two kinds of assets that back a pension liability
The pension liability (the present value of this liability using IFRS assumptions is called defined benefit obligation, DBO, under IFRS) is primarily backed by the plan assets of the company. These are funds that are invested particularly for servicing the pension liability. They are ring-fenced and insolvency-proof. If plan assets are not enough to cover the liability, THEN it is the company itself (with its assets and cash flows) that has to service the remainder. In the case of e.g. German industrial giant Thyssenkrupp AG (TKAG) at the end of the financial year 2017/2018, the DBO of 9.8 bn Euros was backed by plan assets of 2.2 bn Euros. Broken down on a country level one could see that TKAG’s non-German liabilities (calculated using a discount rate of 2.54%) are backed to a very high degree while the German liabilities (calculated at a discount rate of 1.7%) are almost not backed at all by plan assets. In total 7.5 bn Euros of the DBO have to be backed by company assets (or the cash flows thereof).
Overview Pension assets and liabilities ThyssenKrupp AG 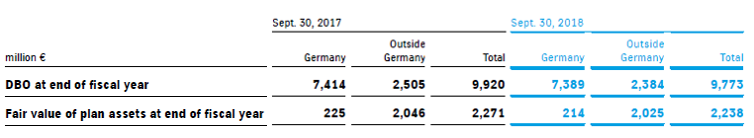
The following graph shows an adjusted version of the Merton model with a focus on pension liabilities. You can see that it matters what companies do with the loan from employees: putting it into plan assets or financing the ongoing operations. 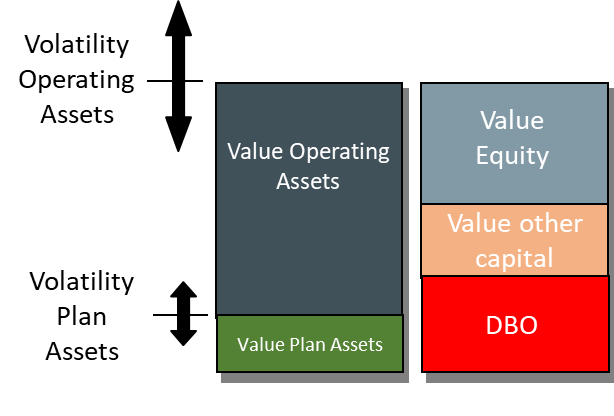
3. Two different assets means two different discount rates
The part of the pension liability that is covered by the plan assets requires (when we forget some correlations for the moment) the risk-free discount rate – at least ‘almost’. It is almost risk free because the degree of asymmetry is basically zero here. Unlike a liability that is only covered by company assets (such as a bond) it is positive here if the plan assets outperform because then a higher part of the pension liability is covered by the plan assets. The part which is NOT covered by the plan assets (the pension deficit) requires a discount rate that mirrors the credit risk of the company. Assuming here that the degree of seniority of pension liabilities equals the degree of seniority of corporate bonds we can take duration adjusted corporate bond yields of this company as a proxy for the calculation. An estimate of the duration of the pension liability can be derived from the mandatory discount rate sensitivity table which can be found in the notes of the annual report. For TKAG we get an estimate of a little bit more than 12 years. As the BB rated TKAG does not have any 12 year bonds outstanding, we turn to the yield curve of a BB benchmark index and get a duration adjusted discount rate of roughly 4.4% (per March 2019).
4. Valuation results and some caveats
Turning this rule of the two discount rates now into a valuation of the pension liability of TKAG (for reasons of simplicity we assume a full funding of the foreign country liabilities and a zero funding of German liabilities) we get a fair value of the German liability of 5.4 bn Euros, and of the whole liability of 7.8 bn Euros. The calculation is done by a) transforming the German DBO into a cash flow stream taking into account its duration, and b) discounting this cash flow stream at the company specific duration-adjusted discount rate. Now deducting the value of plan assets from this liability results in a net position of 5.54 bn Euros. This compares to the balance sheet pension provision of 7.54 bn Euros. This difference in liabilities translates into a value difference of 3,22 Euros per share for a situation where the fair value of the liability is used as compared to a situation where investors see the balance sheet DBO as the relevant liability (ca. + 25% at current share price)! Of course, this is only an approximation. But not a bad one. If, however, we want to do a really sound valuation we have to cover expected cash out-flows for the liability with expected cash in-flows from the plan assets and the company itself – best by way of a Monte Carlo simulation which is calibrated with real capital market parameters (such as bond yields, etc.). And admittedly, also there we have to set some assumptions for the timing of future cash flows because we do not know the cash profile of the different schemes. By using some standard assumptions we still arrive at a per share value difference in our model of 2,89 Euros. And finally an important remark on seniority and default risk, as pension liabilitiy face some special characteristics as compared to bonds. On the one hand, in many jurisdictions it is possible for companies to downward adjust pension payments already before a company is insolvent (although obstacles are quite high, e.g. a labour court decision in Germany) in order to explicitly prevent insolvency (this is risk increasing from a valuation point of view). On the other hand, national re-insurance societies (such as the German Pensionssicherungsverein) usually benefit from their traditional free-rider strategy in restructuring situations. They do not take part in negotiations (in order not to provide a precedent) and hence often take advantage from other creditors’ haircuts (this is risk decreasing). Additionally, in jurisdictions where e.g. pension trustees and regulators push harder for a repair of the pension deficit within a reasonable time horizon (e.g. UK), the probability is higher that the relevance of the insolvency-proof plan assets increases over time in covering the liability (this is also risk decreasing). The bottom line is that in most cases the overall default risk of a pension liability is at our subjective experience a bit lower than what our models tell us because on average the degree of seniority can be seen as a bit higher for pension liabilities than for bonds. Giving a risk credit of 50 bps to the discount rate in our basic model would still result in a per share value difference in our model of 2,70 Euros. 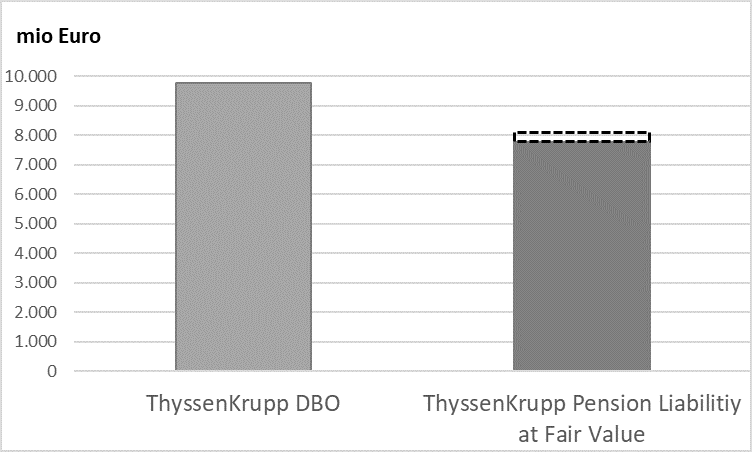
5. Some words on the UBS-approach
UBS-analyst Geoff Robinson recommends to value an existing pension deficit following a “deficit repair” approach. The idea is to determine the present value of the cash-outflows of a company necessary to make away an existing deficit. Once it is gone, the rest is fully covered by plan assets. Let alone the problem that you can only say something about a deficit if you have properly valued the liability in the first place (i.e. following steps similar to the ones above) and assuming here that this has been done at least roughly in an ok’ish way: The idea of UBS is straightforward. And it works. But it is necessary to use the right discount rate. You cannot use – as suggested by UBS – the WACC as a discount rate to calculate the present value of the liability. It is the same way as you cannot use the WACC for servicing financial debt positions even if, here too, it is cash flows from all corporate assets (i.e. the whole balance sheet) that are used to pay back the financial duties. The WACC only makes sense for valuing an entirety of assets and liabilities. For each and every SINGLE asset and liability itself, however, you need a specific discount rate for valuation (the Merton model tells you more about them). The following graph highlights this in a simplified way (positions stated in fair value terms, tax issues not included), with DR: Discount Rate and TA: Total Assets. 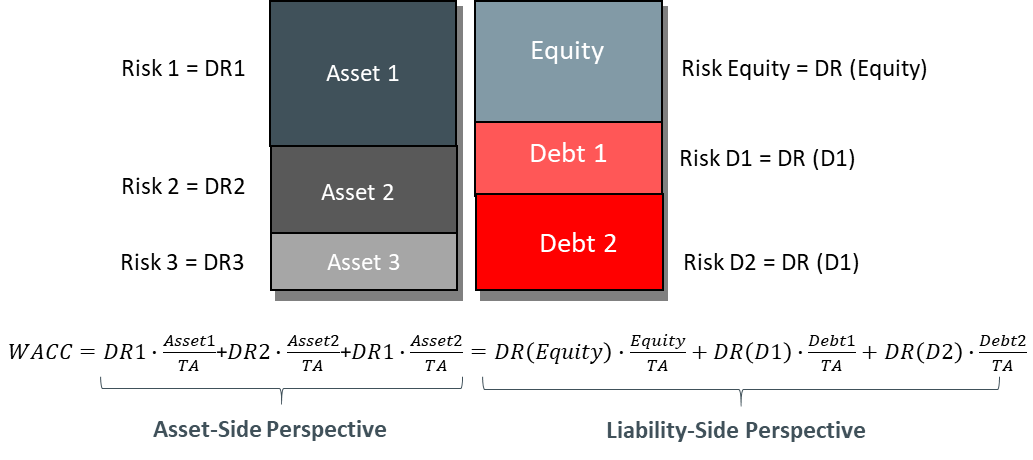 What you can do, however, is treating the deficit repair process as something that is part of the operating business and hence is captured as part of the periodic free cash flows (this is also one variant that is proposed [in fact preferred] by UBS). Then you can use the WACC as a discount rate for the whole free cash flows but make sure that you do not treat the pension liability as a liability-position that flows into your WACC calculation – similar to the equity approach of the DCF variants: if you do not explicitly see it as net debt, then do not explicitly include it into your WACC determination (in the equity approach you basically take nothing as a liability position)! I personally like this variant of the deficit repair approach, but ONLY if this repair path is something that can be reasonably expected (there is a higher chance for turning such a repair path into reality in jurisdictions where e.g. pension trustees explicitly set such paths for companies than in other jurisdictions). If this is the case, an analyst has a manageable forecasting time horizon for dealing with the pension cash flows. And she does not have to think about the above highlighted liability-specific valuation of pension obligations and the determination of an appropriate discount rate. Both make valuations in a real-world, practical setting much more comfortable.
6. Some words on the “actuarial funding valuation” approach
This approach suggests in a first step (correctly) that it is the risk of the assets that back the liability that determines the discount rate. However, taking the approach of BAE Systems as an example (also chosen by the FootnotesAnalysts), in a second step in the valuation the SAME discount rate for the liability is used that is used for the assets, instead of an e.g. Merton model based transformed discount rate – thereby just wiping away 45 years of financial economics evidence on liability valuation and clearly contradicting what we can observe in liability pricing in capital markets. Or put it differently, this approach is perhaps an ok’ish way of planning funding but is nothing a pensioner can count on today. If investment returns on assets are risky (they are!) and symmetrically distributed (assumed) then this approach allows for a fifty percent chance that there will be too much for servicing the liability (ok for pensioners, but they don’t benefit from the surplus) and a fifty percent probability that there will not be enough (bad for pensioners). So, on average you have to be scared as a beneficiary. That’s the nature of probabilities. And that’s the consequence of the asymmetric liability problem. Hence, the FootnotesAnalysts are absolutely right when they reject this approach for valuing a pension liability / deficit for investment purposes.
7. Some words on the IAS 19 approach
IAS 19 suggests to take a “high quality” corporate bond yield to discount the future payment duties to pensioners. In practice this means cum grano salis to take a AA-rated bond as a benchmark. As we now know: This might be appropriate for some companies, because mixing a bit of plan assets [risk free discount rate] with a bit of residual company backing [higher risk] might lead to an AA-bond yield on average sometimes. But it is by no means a valuation approach that fits all sizes. If a company is fully funded (rather rarely the case) then the IAS 19 discount rate is too high. But the more a company is underfunded and has a weak own credit profile (rather often the case, see the TKAG example above) the more the IAS 19 discount rate is too low from a fair-value-to-equity-investors perspective. Hence, this approach is quite general, and not company-, not risk-specific. It is a compromise. But against the background of the materiality of pension liabilities / deficits, it seems to be quite questionable whether this is the right way of dealing with this important balance sheet position for accounting purposes. Even more so, as the IFRS look very company-specific at many other, much less material positions.
8. Final remarks
Properly valuing pension liabilities is extremely important in equity valuation as these obligations make up a big part of the liability side of the balance sheet in many cases. The big question is: What backs the liability? The risk of these assets determines the value of the pension liability, but only after properly taking into account the asymmetric nature of liabilities (the company has to pay at maximum a certain amount but if they cannot do so because of e.g. insolvency they will pay a lower amount; they will however not overpay to pensioners if the backing assets outperform) by e.g. using models similar to the Merton model. This Merton-thinking leads to a result which is often seen as counterintuitive by investors: The higher the credit risk of the company the lower the liability! Good for the company! And it is correct: The higher the probability that a company does not have to pay because of e.g. insolvency, the lower the present value today. But no false hopes here, this is in sum not a positive thing for the company as insolvency risk decreases the value of assets much faster than the value of liabilities. This is also something we can nicely see from the Merton model. And this should of course find its proper way in any DCF-valuation (or even come from it). The valuation discussion here is just a partial screenshot on this one balance sheet position (more on this counterintuitivity problem in our post on the “own credit gain” problem “Barclays‘ Own Credit Gains: Das Fake-Eisberg-Bilanzanalyse-Problem“. Bottom line: The actuarial funding valuation is not an appropriate way of valuing pension liabilities. The deficit repair approach might be ok, if the economics indicate the willingness and ability of the company to repair the deficit within a reasonable time horizon. The IAS 19 approach is a compromise, not more. In most cases it is not a good way of determining the fair value of the liability. A proper way is at my opinion the one shown in this article, however admitting that it still need some assumptions. Therefore, we have to live with a remaining range of possible fair values of the pension liability, but in cases where this liability / deficit is big enough it is worth to go the deep analytical way.