

It is reporting season these weeks! Best time for a little numbers game (for another recent numbers game see our post on how to detect fraud using Benford’s frequency-of-digits rule HERE). Today’s game is about one of the core data in every corporate reporting: The Earnings per Share (EPS).
But we do not look at the visible part of EPS. In fact, in their annual reports (or in their disclosure anyway) companies usually provide earnings per share measures down to the Euro cent – or pence, or centime – …. but not any further. This is well understandable in terms of presentation of results. But it should not be forgotten that the presented EPS is only the result of a rounding procedure. If the number after the Eurocent is a 4 or lower, than the presented EPS number is the result of rounding down. And if this next number is a 5 or higher, than the presented EPS number is the result of rounding up. So, sometimes a little change in the after-Eurocent number (e.g. from 4 to 5, or the other direction) can change the whole disclosed EPS. But this rounding procedure is usually hidden from the eyes of analysts and investors… it happens in the dark!
Let’s first start with some fundamentals: Under IFRS there are basically two versions of disclosed EPS that matter: a) the basic earnings per share and b) the so called diluted earnings per share. a) is just the division of net income by the weighted average number of ordinary shares outstanding during the period, whereas b) also includes the potential dilutive effects of future generation of new ordinary shares (e.g. via options or convertibles) in the net income as well as in the ordinary share count (for more details, see IFRS 33 Earnings Per Share).
Whatever measure of EPS companies provide – basic EPS or diluted EPS – there is always room for some manoeuvring for CFOs. This is not a big surprise as our accounting systems allow for quite a lot of management discretion – of course with standard setters’ ultimate goal of allowing a better and more economic presentation of results than it would be possible without this discretion. However, readers of this blog should have already realised that in most practical cases this discretion is not always used by management to allow for a true and fair view of the company’s situation but rather often shows some undesired asymmetric characteristics in reporting reality.
And management’s incentives for this asymmetry are particularly high when it comes down to EPS calculation – simply because this is such a dominant and important single-number measure for investors. Moreover, EPS are a parsimonious measure of success. EPS bring a very big number with many digits (net income) down to an often only three- (e.g. 3,78 €) or four- (e.g. 15.92 €) digit number. This is now where the rounding game becomes relevant.
In reality this means: Why not thinking one step ahead, some CFOs might contemplate, and moving this EPS measure a bit upwards if it allow this very tiny better presentation of performance? In particular, this actually means in reality: if the relevant post-Eurocent number is a “4” (meaning rounding down at the margin) then perhaps CFOs might find ways to push it up to a higher post-Eurocent number (meaning now: rounding up!). Just a little move. But take care: At first glance this might look like counting beans. However, for many companies just a one Eurocent difference in EPS can mean quite a lot in the eyes of their investors – and sometimes also a lot for their management remuneration. To make it clear: It is not a superfluous exercise to look at the Eurocent position when analysing EPS, not at all!
The basic idea of this rounding game effects goes back to the very interesting paper Malenko/Grundfest (2014), Quadrophobia: Strategic Rounding of EPS Data, see HERE: the original version is from 2010). The authors could show in their analysis that the number “4” is significantly underrepresented in in the “first post-decimal digit”, i.e. the digit just behind the USD-cent or Eurocent (or similar) number. This means that rounding-down (something CFOs do not like to do) is – at least at the margin – less likely than it should be. The database for their analysis is a global set of firms as they state to use the firm quarter observations from Compustat. However, they restrict their analysis to quarterly earnings measures which reduces the analysis to the more developed markets.
A very important additional finding of Malenko/Grundfest is that companies which show unnaturally low “4” frequency in the respective position over time are also more probable to be affected by other accounting problems such as general aggressive accounting practices (which sometimes even lead to restatements), SEC enforcement actions and even class action securities fraud litigation. Hence, the missing “4” is not only a peccadillo but rather a potential indicator for a bigger corporate governance issue.
In 2010, the Wall Street Journal WSJ (see HERE) commented about the then initial study findings and provided a nice practical example for this. According to WSJ, Computer producer Dell Inc. didn’t report a single “4” in the third digit behind the USD-point between the IPO in 1988 and 2006 – implying a probability of 1 to 2,500 that this happens just by chance. In 2006 then, Dell ran into an investigation of its audit committee which finally resulted in 2007 Form 10-K comments of the company that “The investigation found evidence that… account balances were reviewed, sometimes at the request or with the knowledge of senior executives, with the goal of seeking adjustments so that quarterly performance objectives could be met.”
Furthermore, in 2018 WSJ reported about an ongoing bigger SEC probe (see HERE) which – according to WSJ – entailed that the SEC has sent queries to at least 10 companies, requesting information about certain accounting adjustments that might lead to a push-up of their EPS. We have no information about the concrete outcome of this probe (but we also haven’t done a thorough analysis here).
As we also do not have any regional split-down of the Malenko/Grundfest-analysis we think it is a good idea to do it ourselves here for Euro-zone companies. We do this by analysing the annual EPS reporting behaviour of the enlarged Euro Stoxx index (roughly 300 shares) of the period 2009-2018. We use data from Thomson Reuters Eikon for our analysis.
Before starting our analysis, a first important comment is necessary. One might initially think that this is also a case for Benford’s law which allows to draw conclusions on the frequency-of-digits that a non-manipulated accounting number provides. However, Benford’s law is a nice tool for the first digits of a number, perhaps also a bit for the second digits of numbers but then it loses power. In fact the further we go down the digits, the more it is natural that they follow a uniform distribution. So we cannot really use this law for the outer digits of EPS numbers. Below we provide the assumed distribution of a non-manipulated set of numbers for different digit-positions according to Benford’s law.
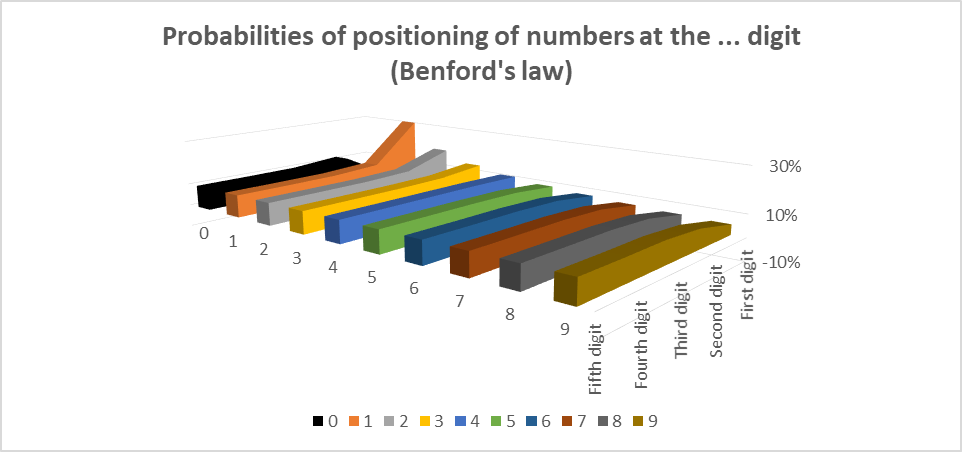
Here we can see, that the distribution should be very uneven for the first digit (zero is excluded from the first digit), a bit uneven still for the second position – but then it evens out. Already with the third digit, the probabilities for the showing-off of a certain number are basically 10% each. Hence, for our exercise of analysing the first digit after the Eurocent we can perfectly assume an even expected distribution of all numbers – 0 to 10.
And now we can start: We collected 2,914 data points over the period 2009-1018 (i.e. some missing data). The results of our 10-year analysis shows the following patterns with regard to the first digit behind the Eurocent (i.e. the third digit behind the Euro, just the digit which is usually the first one in the dark).
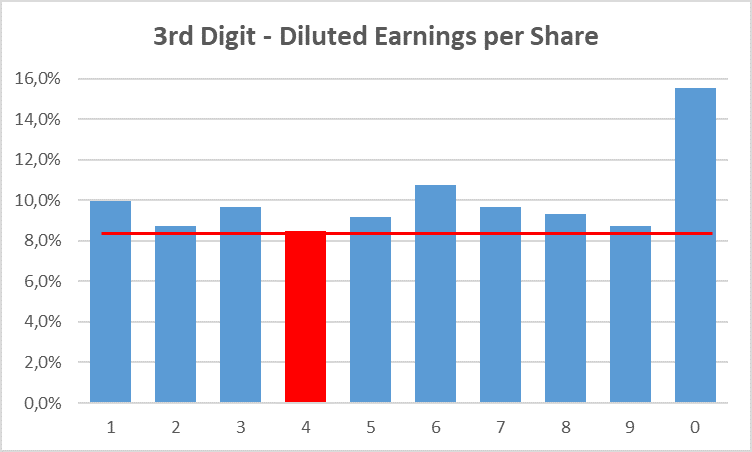
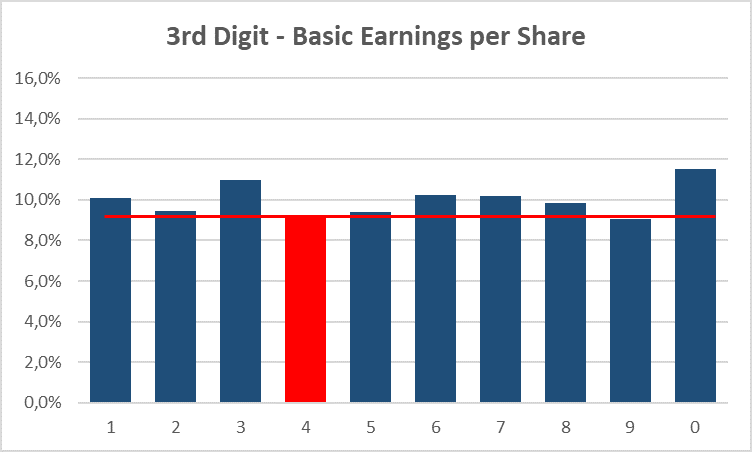
We can see that for diluted EPS the “4” is in fact the least frequent number in our dataset. For basic EPS the number “4” is still at low frequency but interestingly the number “9” is even less frequent.
Now this could all be just a fair distribution with some natural deviations. We have to do some more analyses before making an assessment. For this we apply a simple hypothesis test (one-sided, i.e. answering the question whether the number “4” shows up actually in 10% of the cases of the distribution or less). Based on this test we find out that for diluted EPS the number “4” shows up at LOWER than the expected 10% frequency of the observations at a 5% significance level, which is quite a striking result. For the basic EPS we found that the number “4” shows up at LOWER than the expected 10% of the observations just at the 10% significance level – still striking but not so powerful as for the diluted EPS.
However, from the distributions above we can also see that the number “0” is obviously overrepresented in both measures. This might be in parts due to Thomson Reuters Eikon data are not going down to the single Euro or the single share count (and hence some other rounding errors), although we have not detected many clear zero-numbers, i.e. EPS numbers which are exactly at the Eurocent with no further digits after them. We comment on this issue below again, but for our analysis we also want to restrict ourselves in a second step to a comparison of the number “4” excluding the number “0”, i.e. asking whether the number “4” is underrepresented amongst the numbers 1-9 (meaning whether the frequency is lower than 11.1% [or 1/9] amongst this reduced number set).
Excluding the zero still leads to the result that the “4” shows up at LOWER than 11.1% at a 5% significance level for the diluted EPS. For the basic EPS we could, however, not find any meaningful significance level anymore. The number “4” frequency seems to be in line with an even distribution for basic EPS.
In a further analysis we would like to find out whether this underrepresentation of “4” is restricted to specific companies or whether it is just a general phenomenon. For this we tested whether the number of companies which did NOT show a single “4” at the respective position over the whole 10 years is higher than one would expect in a random setting (comment: We only included companies in our analysis here which showed a full 10-year set of data).
To make it short for the basic EPS: We could not find out any higher number of companies than expected. But for the diluted EPS we could find out that there are MORE companies which did not show a single “4” over the whole period in the respective position at the 5% significance level than one should expect based on a random set of data.
So what does this all mean? These are our conclusions:
- Euro-Zone companies show an unnaturally low frequency of the number “4” at the digit just behind the Eurocent for their DILUTED EPS measure. This is even true if we exclude the high “0” frequency. This means that there is a high probability that these companies – on average – manage-up their diluted EPS in some way.
- This finding is not evenly distributed amongst all companies but it is rather clustered in some companies which seemingly show the number-4-aversion constantly over time. This suggests that some companies rather go for this technique constantly over time but some others not at all. This is in line with the idea that there are some little cheater companies which apply this technique, and others which don’t.
- For the BASIC EPS measure we couldn’t find this relationship, or only a relationship at a very mild level. Not enough to draw hard conclusions here.
- The data for our analysis are not perfect. The Thomson Reuters Eikon data already entail some rounding. In particular this show up by the high frequency of number “0” observations. This certainly weakens our analysis. We admittedly cannot derive a very clear statistical inference here. However, even with this uncertainty we think that our conclusions about the DILUTED EPS are somehow robust – at least from an economic point of view (the significance level at 5% is really high!). But we admit that some more – deeper – analysis would be necessary to clearly make a point.
- In our today’s post we do not want to go deeper into single-company disclosures. We might do this in one of our next posts. This present post is rather about highlighting that the rounding game is existent with regard to DILUTED EPS in general.
- The Malenko/Grundfest (2014)-paper draws some further conclusions regarding the circumstances under which companies are more probable to go for this game, and also what this means in terms of the general behaviour of future performance and general corporate governance. We have not checked any of these aspects here in our analysis. Our analysis is just a high-level observation.