

Northgate Group Plc. is UK’s biggest provider of light commercial vehicle rental services, with operations in UK, Spain and Ireland. Its business model is relatively straightforward. The company acquires the vehicles, rents them out over a certain period and sells them at the residual market value at the end of the renting phase.
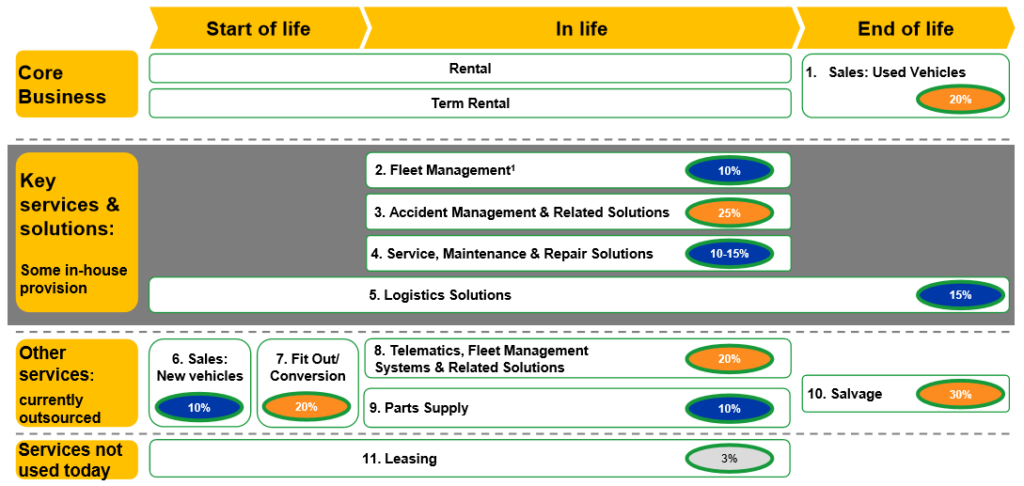
Source: Northgate, Financial Year 2019 Results, Presentation, Slide 22.
While in pure cash-terms this is a business like many other businesses, in accounting terms it shows some special characteristics. The tricky aspect here is that the vehicles change their accounting nature over time. First they are fixed assets which generate rental income, and after that they are inventories that are sold to end-customers. But once these vehicles become inventories they have already a relatively long life of action behind them. So, the question arises what a proper accounting value path of these vehicles is over time. And if we ask about accounting value paths of assets, we have to talk about “depreciation”. And in fact, for Northgate the treatment of the depreciation policy is clearly the crucial point for understanding the profit generation process.
In theory, we know very well how an appropriate depreciation schedule has to look like in order to allow for a proper performance measurement. The so called “relative benefit depreciation” technique (see e.g. Reichelstein (1997): Investment Decisions and Managerial Performance Evaluation, in: Review of Accounting Studies, 2, p. 157– 180) ensures that periodical value changes of assets follow an economic path and lead to an unbiased profit determination. However, this technique requires a forward looking accounting value determination (in contrast to our usual historical cost based accounting value determination) which more or less leaves this technique an academic exercise which is not reasonably applicable in accounting practice.
Hence, in reality we rather see simplified value development paths such as those based on the straight-line depreciation schedule. Such proceeding is perfectly understandable from the view point of practical application but it is worth to understand the limits and problems of it and why certain business models – such as Northgate’s – are particularly prone to these problems.
We start our analysis by first having a look at how companies which offer such a split-business of both renting and selling generate profits (it is enough here to look at the operating profit generation). For the start, the numbers in these examples are just simplified hypothetical numbers for illustration purposes (but this will change later). Imagine a company rents vehicles over a period of 5 years after they are bought (original acquisition price per vehicle: 100 €) and then sells these vehicles for 50 € each after these five years. For the rental services the company generates revenues of 50 € in each of the first 5 periods. The company anticipates the future selling price correctly, depreciates the vehicles over 5 periods with an expected salvage value of 50 € at t=5 (i.e. on a straight line basis the depreciation charge is 10 € each year). In our example no other operating costs are included.
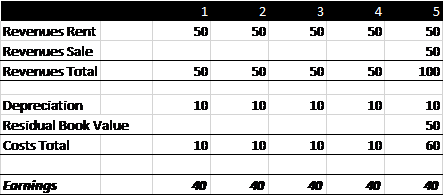
As we can see, this company earns a profit of 40 € each period for 5 years (totalling 200 € over the 5 years). The selling of the vehicle is profit-neutral as the selling price equals the residual book value in period 5.
Now imagine the company uses a different depreciation schedule. Still straight-line, but now a full depreciation down to zero over 5 years. Might be that this is done because the company does not know the future market selling price before (and thinks it is zero at inception of the depreciation schedule, i.e. at t=0) or might be that this is done on purpose – just using the leeway that depreciation rate setting entails. Anyway, now the table looks as follows.

Now the periodical depreciation charge is 20 €, the first years’ profits are accordingly lower, but due to the heavy accounting value reduction over time the company can generate a decent profit on the sale of the vehicle (50 € selling price vs. 0 residual accounting book value at this time). Important: In total the company still earns 200 € over the 5 year period.
The consequence of this implicit shortening of the useful life of the vehicles is obviously a profit shifting or more concrete here a back-loading of earnings for a single vehicle project. As the company perhaps runs more than just one car this development might somehow get smoothed a bit. But if the company is in a growing state this back-loading would result in a periodical reduction of earnings as compared to the initial case presented here. Of course, going the other direction (i.e. lengthening the accounting useful life of vehicles by reducing the depreciation charge in the first periods) would lead to the opposite effect: First periods show a higher profit, and year 5 shows a lower profit as the company would record a loss on the sale. Hence, in a growing state lengthening the accounting useful life leads to an increase of periodical earnings.
This effect is well known and we have already discussed this issue in one of our blog posts (HERE). But this is not the real magical trick that companies can do with such a split business (renting and selling). The real interesting case goes a bit deeper.
For the further discussions we first have to have a look at what happens if a company thinks that the historical useful life assumptions are no longer valid but have to be changed. In this case IFRS tell us that the carrying book value at the date of when the company changes its estimate about the useful life is not changed but this carrying book value is now depreciated in future periods according to the new useful life assumptions (IAS 8 Accounting Policies, Changes in Accounting Estimates and Errors). E.g. for a vehicle (still: original purchase price: 100 €) that has been depreciated over 2 years assuming an original 5 period useful live (salvage value: zero) which at the end of period 2 is assumed to have a useful life of rather ten years (or a salvage value after five years of now 37,5 €) the accounting path would look as follows.
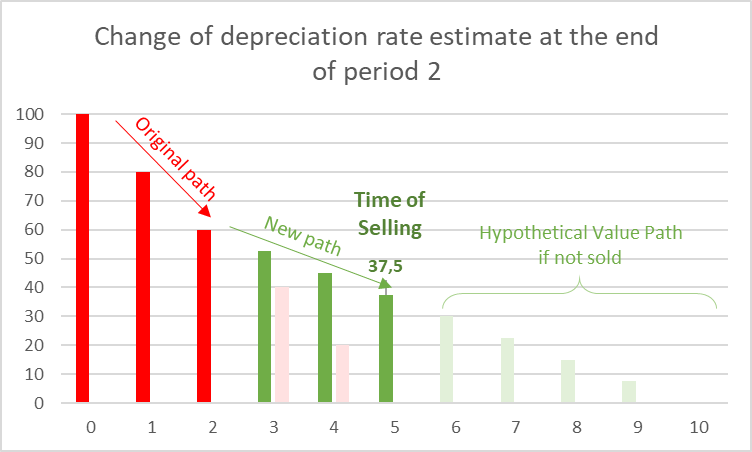
It is understandable from a practical point of view and from the basic conception of IFRS that no restatement of the carrying value at the beginning of the estimate change takes place, but it is worth highlighting here that this proceeding is quite different from the theoretical ideal of the above discussed relative-benefit-depreciation schedule (because when the useful life of the vehicle is in fact 10 years than the historical depreciation charges have been too high, i.e. the carrying book value according to IFRS overstates the fair carrying book value in an ideal accounting system). However, this is the accounting system financial analysts (and companies) have to deal with.
Now, what does this mean for the profit generation of the company over time? We have a look at a hypothetical company which is in a no-growth state but runs several vehicles such as the one in our example above – more concrete: each period the company buys one vehicle, rents it over 5 years and then sells it. From a pure operational point of view the company is in a steady state.
As long as the company does not change the estimate of the useful life, and with the know-how of our analyses above we can see that in this case it does not matter for total earnings whether the company assumes a salvage value of 50 € after 5 years or a zero salvage value after 5 years. However, the distribution of where these earnings come from differs between these two cases (no earnings from selling the vehicles in the first case and 50 € per period for selling one vehicle each period in the second case).
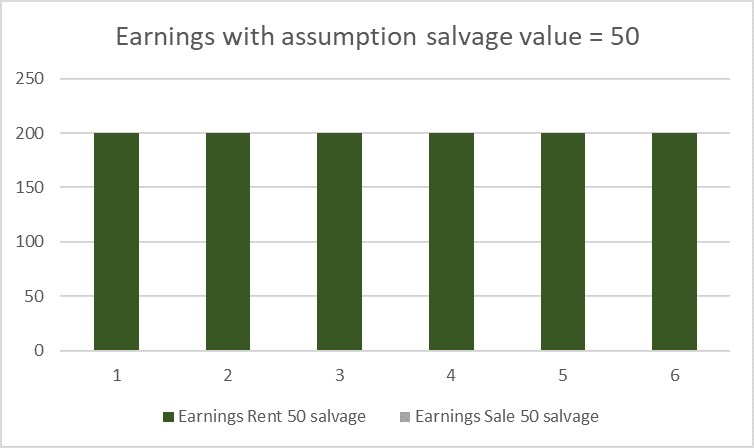
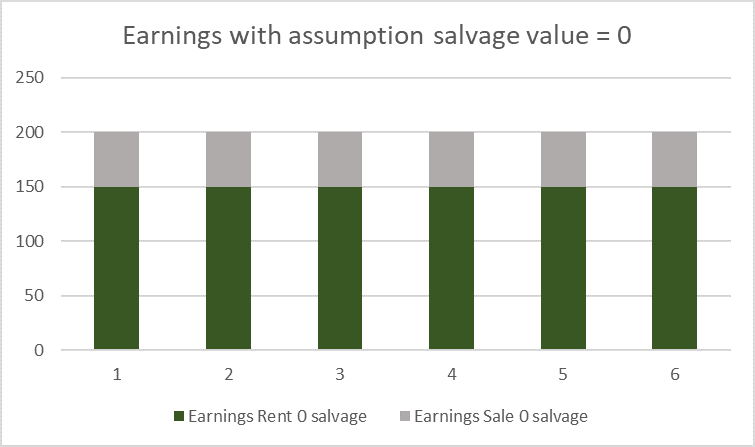
Comment: In the “50 € salvage value” case earnings are the result of 5*50 € rental income minus 5*10 € depreciation (steady state), and accordingly in the 0 € salvage value case.
And now it gets interesting: What happens with the earnings if the company decides on the way that the original useful life or salvage value assumption is no longer appropriate but that it has to be changed (a change in accounting estimates). We look at the case where the company increases the useful life assumption (or equivalently increases the salvage value assumption, both are the same from an economic point of view). Let’s look at the profit development for two different cases of such changes: a) a sudden increase from zero salvage value to 50 € salvage value, and b) a gradual increase from zero to 50 € salvage value in 10 € steps per period. The change of estimates happens in period 4.
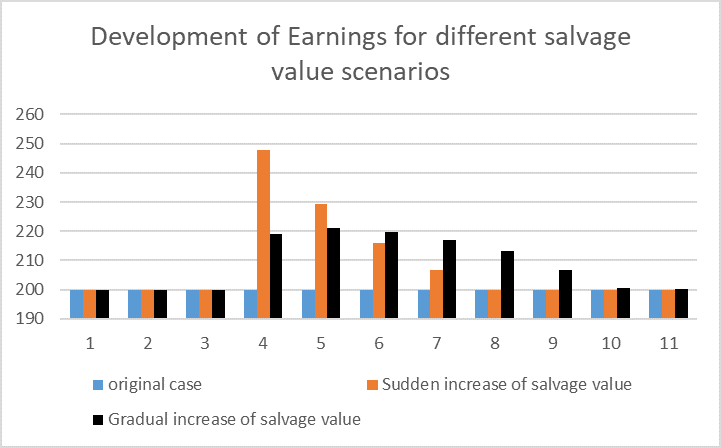
This is a quite interesting picture! Obviously with changes in estimates a company that runs such a split rental-selling business can push its earnings, it can create earnings seemingly out of nowhere – at least for some time! Why is this the case? Some comments are necessary:
- The change in depreciation policy immediately relates to the whole fleet of vehicles that are up for rent. I.e. the whole rental business is affected and benefits. However, the selling business is not immediately affected, it only gets relevant for the selling business once these now differently depreciated vehicles get into the state of being sold. And this takes time. Only once all these vehicles that are now affected by the salvage value estimate change are being sold, the profit turns into a new steady state (again 200 €). This is the case in the graph after 5 years for the “sudden increase” case and much later for the “gradual increase” case.
- This profit development is the consequence of IFRS (and US-GAAP) depreciation rules. This would not be possible in an academically ideal depreciation setting following the relative-benefit-depreciation schedule. But again: it is accounting reality that we have to deal with…
- The profit generation “out of nowhere” is not really a profit generation out of nowhere. It is rather a correction of past (periods 3 and before) underestimating of profits – but with now high periodical impact over the correction period. And honestly, this is nothing a financial analysts can spot without any further information. He/she would have to correct the whole history of the companies accounts to find it out.
- Of course, this effect also works in the other direction. If companies reduce the salvage value (or reduce the useful life of assets) then we would see a temporary negative burden to earnings. But this is not our case today (as Northgate is rather the case of increasing the useful life).
But how are things at Northgate Plc.? Let’s have a look at what the company disclosed in its 2019 annual report. On page 35 they show the operating profit impact of depreciation schedule changes.
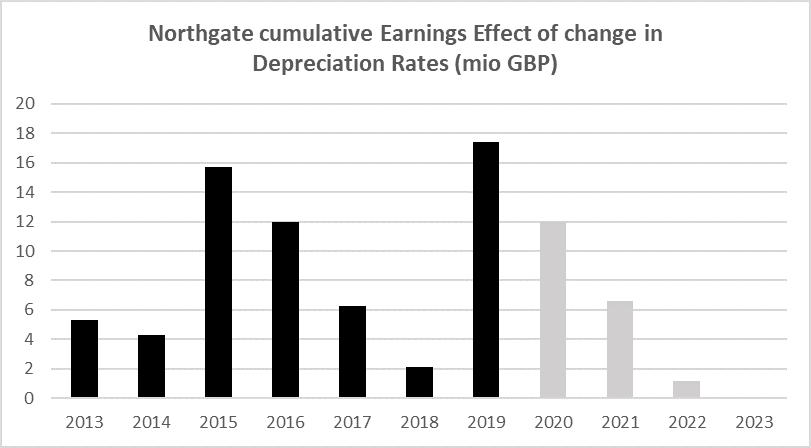
Source of numbers: Northgate 2019 AR, p. 35, own depiction. Legend: black columns depict the historical effect on earnings, grey columns are Northgate’s expected effect for the coming years .
So, this disclosure looks exactly like our above depiction of an immediate increase of salvage values – here in repeated terms. Obviously, there was a some change in estimate before 2013 which slowly evened out, until there is a new (sudden) change in estimates of salvage values in 2015 (slowly evening out) until another (sudden) one in 2019! This is perfectly in line with our analysis above (which only took into account one single estimate change shock).
A very important comment here: We give lots of credits to Northgate Plc.! The company really tried to explain this effect on several occasions. E.g. in its 2016 Annual Report the management shed much light on this problem in a 4 page long explanation (p. 32-35). And in its 2019 annual report they clearly disclose the full number effects of changing salvage value / useful life effects by providing the above shown figures. The company is obviously well aware of the above mentioned effects and management tries to bring it to the capital market’s attention.
Furthermore, at least the recent (2019) changes in salvage value / useful life assumptions are not a consequence of Northgate thinking differently about its assets lives or values, it is simply a consequence of a change in the fleet optimisation strategy of the company since beginning of 2018 which since then has its focus in an increase in the holding and rental period of the vehicles.
However, we cannot give all the credits to Northgate Plc. While relatively clear in its disclosure about the shortcomings of its depreciation schedule, management still benefits from these accounting effects in its remuneration system as the profit-effect (positive push) in most of the recent years overcompensated the capital-employed-effect (also pushed up) with the consequence of higher measured Returns on Capital Employed (ROCEs) than economically justifiable. And ROCE is a critical variable for management remuneration as we can see below.
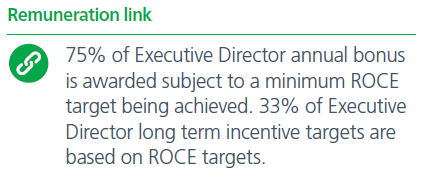
Northgate Annual Report 2019, p. 26.
In summary, for a financial analyst there are some important conclusions to be drawn:
- Profits are a weak periodical measure of success for such a business model. The same is true for ROCEs. At least if these measures are based on accounting conventions.
- This business model really screams for a cash-flow based analysis. If our IFRS depreciation scheme allows for such misreporting of periodical performance then an analyst has to build up a more dynamic model. Perhaps he/she will not be able to really bring in the whole ideas of the relative-benefit depreciation but at least a better periodization of success should be possible.
- Don’t get distracted by single business line performances (which the company discloses since recently). This is an integrated business. The longer Northgate rents its assets, the higher the rental income, the lower the selling income – and vice versa. And it is important to note that there is a sweet spot of renting duration (Northgate itself had to experience this the hard way when they realised in early 2018 that their until-then run early-vehicle-selling strategy turned out to be not very powerful). Understanding this balance between renting and selling performance, and hence finding out where this sweet spot is, is – certainly over and above the general economic cycle which impacts this business – extremely important for a proper valuation of Northgate’s equity.
- It is also important to read between the lines of Northgate’s 2019 disclosure of the cumulative earnings effects of changes in depreciation rate (AR 2019, p. 35, see figure above). Will the recent depreciation rate change be really the last one? Or can we expect some more of these changes in the future (which might lead to an ongoing overstatement of operating profits, ROCEs and hence management remuneration benchmarks also in the future)? What if Northgate management one day finds out that the sweet spot of renting duration is rather earlier than currently estimated? Can management really change its strategy towards a shorter useful life (or lower salvage values) against the background of then being punished by negative accounting effects on its core remuneration benchmark ROCE? Or will management change the remuneration benchmark once there are no more positive effects to be expected from the depreciation rate changing game? Lots of questions on which we do not have any answers today. Let’s see how the coming years evolve…
Disclaimer: As always, we hold no economic stake in the company involved in this blog post – in whatsoever direction. We base our analysis on imperfect information and hence we might be wrong with some conclusions. This is just our subjective view and no investment recommendation at all.