

On 26 July 2019 Renault S.A. published its half-year figures. Many investors and analysts were surprised by the relatively high operating earnings of the company (ca. 4% above I/B/E/S consensus estimates). And the reason for this beat was quickly found: Renault increased the percentage of research & development (R&D) spending that moves directly onto the balance sheet up to the highest level in the last 10 years: almost 55% were capitalized in H1/2019, leaving only roughly 45% of the spending as an expense, i.e flowing immediately through the profit & loss statement. And lower R&D expenses means higher operating earnings (at least at first)!
The capital market participants didn’t feel comfortable about Renault’s way of accounting treatment of R&D in H1/2019. In several research reports one could read about the “low quality” earnings beat with earnings and cash flows clearly moving apart. But looking closer at Renault’s way of treating R&D spending it is not really appropriate to start with the big outcry just now – even if the very high level of R&D capitalisation is really one of a kind in pure quantitative terms. In fact, Renault has been managing its R&D capitalisation ratio already for a long-time – at least since H2/2014 (where we start our analysis), with H1/2019 being even rather one of the sounder reportings. So, investors should have better complained much earlier than only now. But let’s analyse this in more depth below.
We first have a look at what IFRS tell us. IAS 38 sets the rules for whether costs for R&D are to be expensed or capitalised. The standard makes clear that all research costs have to be expensed (IAS 38.54) where “research” covers the rather basic and first step of the product generation process. However, development costs have to be capitalized once technical and commercial feasibility has been established (IAS 38.57). According to IFRS “development” here obviously describes a state which is close enough to the final product so that it is quite probable that the costs do not simply vanish but can be monetized at a later point of time. In principle, this makes a lot of sense. Much more than the US-GAAP approach which foresees a full expensing of all R&D spending. But in practice this is a very weak spot of IFRS accounting as the lines between (expensed) research and (capitalized) development are blurred. Hence, it is not a big surprise that CFOs are sometimes quite happy to use this research/development-twilight-zone for moving periodical expenses a bit (or more?) into one or the other direction.
In the H1/2019 analyst call Renault management, however, explained quite clear why the R&D capitalization ratio has increased. Renault is just at the end of a longer research and development cycle, with a strong new model launch offensive now upcoming within the next 1 to 2 years (e.g. new models of the Clio, Kangoo and Sandero). So by nature, the technical state of products is getting close to the positive end and the commercial state shifts more towards higher monetisation probability. This line of arguments seems to be quite convincing in our eyes.
But jugding Renault only by H1/2019 would not be enough here. In fact, if we have a closer look at the earlier reporting periods we can detect quite a remarkable correlation between Renault’s pre-R&D operating margin and the percentage of R&D expensed already much earlier than only in H1/2019. Obviously, in times of weaker margins, Renault systematically expensed less R&D – meaning it gave (for good or bad reasons, we do not know exactly yet) a bigger boost to the (post R&D) operating margins in bad times and much less of a boost in good times. In this context it is important to note that the target indicator of Renault’s P&L performance guidance to the capital market has always been the (post R&D) operating margin in the last years.
In fact, the correlations of pre-R&D operating margins and R&D spending are ultra-high since H2/2014 (at roughly 78% until H2/2018). Moreover, digging deeper into the numbers, we can also see that the Renault way of accounting for R&D also lead to much lower volatility of earnings over the years than an application of an average R&D expense ratio would have lead to. The graph below speaks for itself (data taken from Reuters Eikon).
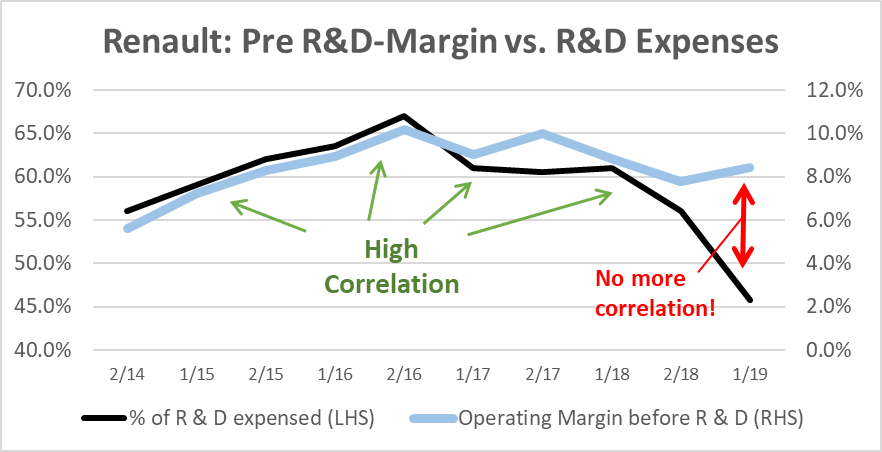
Looking at this graph we can see that depending on the level of the pre-R&D performance Renault manages their post-R&D margins a bit up and down by altering the R&D expense ratio – not super-material, but enough to get closer to the desired level of guided operating margins: a nice little sweetener! But in H1/2019 things look somehow different. We couldn’t see this correlation any more (in fact, including H1/2019 into our numbers, the correlation coefficient for the whole period since H2/2014 goes down from 78% to 45%). In H1/2019, the operating margins were up anyway, so an additional boost does not seem to be necessary here. Or does it? A couple of additional comments are necessary here:
- H1/2019 is not really a super surprise if we look at the numbers in total. Renault holds a stake in Nissan which is accounted for at-equity, meaning its earnings contribution does not flow through the operating profit but rather through the financial result. In H2/2019 Nissan disclosed very weak earnings which basically drove the whole net income of Renault down. So perhaps Renault this time did not only look at the operating margin but management also scratched their heads about the very bottom-line. This could serve as an additional explanation for the decreasing R&D expense ratio even in times of operating margin improvement this time (interestingly, the Nissan stake is highly material for the value of Renault shares – it makes up the major part of it in our valuation model).
- Admittedly, in many real-world cases correlation is not automatically equal to causality. But it is often at least a bit of causality. So it could well be that there is a good economic reason for this high correlation number. In the case of Original Equipment Manufacturers like Renault the times of high earnings and cash flows are often the ones where new products are launched, and also a lot of R&D can be capitalised because now customer market proximity is high. So a bit of correlation should also be expected from the numbers. However, there is usually still a time gap between R&D customer proximity and good performance. FIRST R&D becomes more development-like (more capitalization) and THEN revenues should go up. So correlation is certainly not fully equal to causality (in the same period).
- Still, looking at the recent development at Renault from a fundamental point of view, the accounting treatment makes some sense to us. The R&D expense rates went down since H2/2016 (implying the capitalization rates went up) which is absolutely in line with the approaching big product launch in the coming months. So the development of the numbers is at least not totally unreasonable.
As a summary: What we see here is something that we see quite often. There is certainly some part of this development of numbers which can well be explained from a fundamental point of view (otherwise auditors would not nod it through). But for our understanding the correlations are still too high (and not time-lagging sufficiently for making 100% sense from a fundamental perspective). This is why we think there is still some active margin management by Renault. But how much is fundamentally explainable and how much is earnings management? This requires a lot of deep analysis to find out, and we cannot disclose our findings in detail here. However, the across-the board comments from some analysts on what happened in H1/2019 (“low quality”) without any further analysis seem to be a bit premature in our view and not very well differentiated. For such business models it rather is of utmost importance to get the signal from the changing R&D expense-vs.-capitalization ratios right (and to exclude the “noise”, i.e. the earnings management from it). So, there is more to learn from what happened here…
Final remark: For those of you who are auto-addicted and find this R&D asset-vs.-expense game interesting, it is worth to have a closer look at Ferrari SpA. They also pushed-up their R&D capitalization rate in the H1/2019 numbers. And here it is at our opinion much less supported by economic content. But as always: This is not an investment recommendation. All my views are subjective. And, as a matter of course, I might be wrong with my analyses.
Appendix: How does the R&D asset-vs.-expense game work?
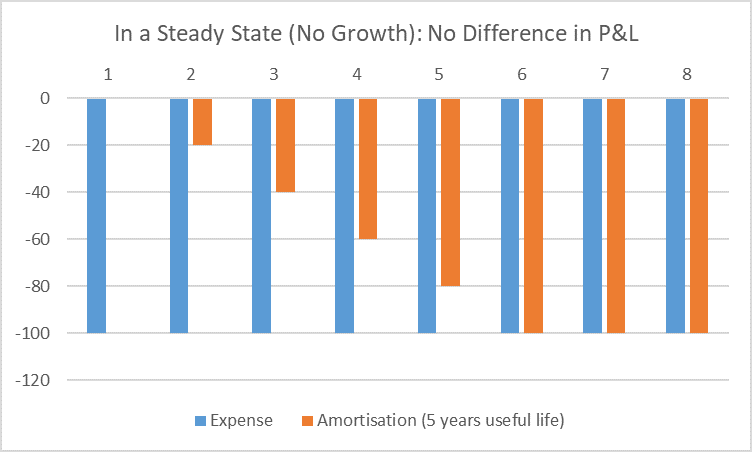
The benefits of capitalization of R&D are twofold. First, the assets (and hence shareholders’ equity) increase. But we do not want to look at this effect here (see e.g. https://valuesque.com/how-iff-will-build-up-a-huge-accounting-original-goodwill-the-umbrella-category-financial-analysis-problem/ for more on this) . Second, earnings might be different. In the most simple case of a company that is not growing and which is in a steady-state, this is, however, not the case. Capitalized R&D has to be amortized, and in the steady state the amortization charge (in case of capitalization) exactly equals the direct R&D expense in case of no capitalization. In the graph below the steady-state is reached in period 6 (ramp-up of an amortization schedule for a 5 year useful life and amortization starting in the period after costs are incurred).
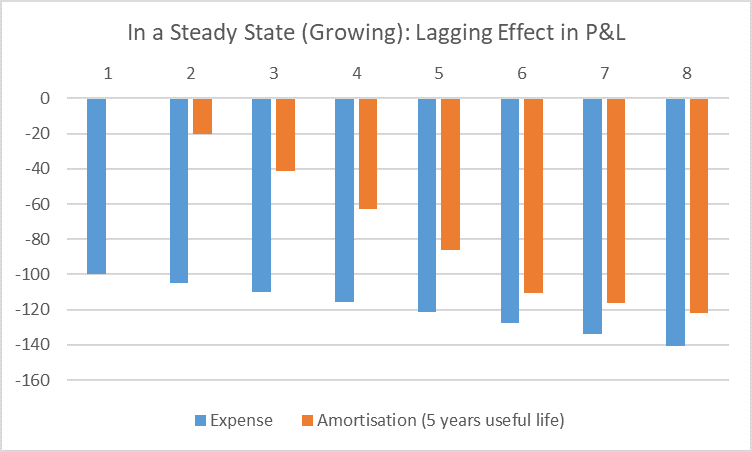
However, if the company is growing (even only by inflation) then capitalization leads to lower expenses, i.e. higher earnings, because of amortization lagging outright cash outflows (some of the amortization relates to cash outflows which have been done a couple of years ago). So if we assume positive growth, a higher capitalization rate always benefits the company in terms of lower total expenses and hence higher earnings – even in the steady-state.
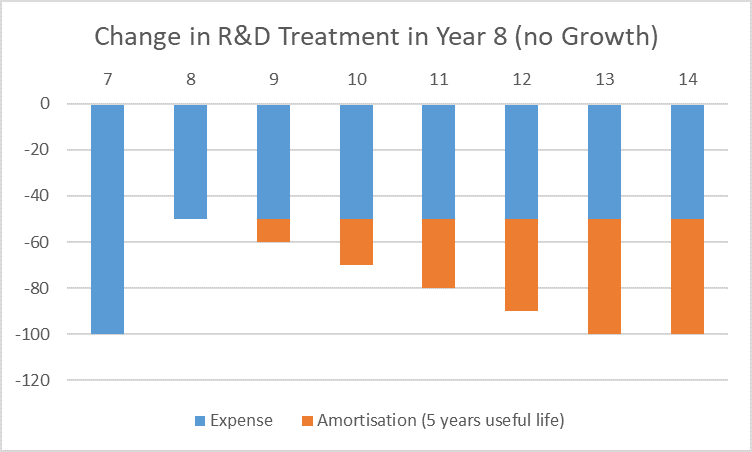
And finally, if the company is not in a steady state (and in reality it never is): then a sudden change toward a higher R&D capitalization rate has a temporarily highly positive effect on earnings (and of course a change towards a higher expense rate has a temporarily highly negative effect on earnings). This is why playing the asset-vs.-expense game only a little bit can have quite remarkable effects on the P&L performance. In the graph below the company switches in period 8 from 100 Euros expensing before to now only 50 Euros expensing and 50 Euros capitalization (no growth assumed here for reasons of simplicity). It becomes clear that due to the ramp-up of amortizations it takes a lot of time until the original expense level is reached. A great boost to earnings!
But be careful. This is a double-edged sword. Once companies increase their capitalization rate, they get more and more forced to perhaps reverse it at a later point in time. And this leads to the opposite effect. In Renault terms: Be prepared that there is a negative earnings effect once the big launch programme is finished. But also this should not come as a surprise to you.