

In my recent articles on financial analysis (see https://valuesque.com/aktuelles/) I mainly focussed on some fundamental analyses that should show whether companies stretched the discretion that they have in financial reporting too much from an economic point of view, or whether they possibly even stepped over the threshold of what is allowed in financial reporting. Today I want to approach this topic from a purely non-fundamental, a quantitative point of view. I look at an interesting approach which clearly targets at finding accounting fraud by just looking at the stated numbers: Benford’s law!
Benford’s law – first clearly described in 1938 and named after the physicist Frank Benford (although detected far earlier, see Newcomb, 1881, Note on the Frequency of Use of Different Digits in Natural Numbers, American Journal of Mathematics) – describes the patterns and frequency of the first, second, third, etc. digits in numbers that are not bound per se and follow e.g. a natural exponential growth process such as economic or biological data. According to Benford’s law the distribution of the first digits of a large set of such data look as follows.
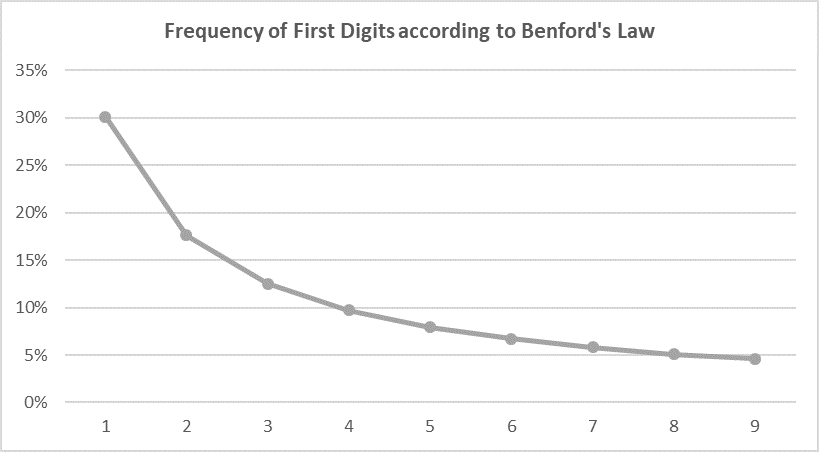
This means that at the first digit the “1” shows up with a probability of ca. 30%, the “2” with a probability of ca. 18% and so on until “9” shows up at a probability of 4.6%. But why is this the case? Stated in very simple terms: If you start by zero und count up, you get an even distribution of first digits until 9. Then you get the next ten numbers with a first digit “1” (10-19) – so until 19 a clear domination of the “1” as the first digit. This will then slowly even out with other digits being in the first place – first with “2” catching up in frequency (20-29), then “3” (30-39) and so on – until you reach 99. Then again you have a long phase of “1” in the first place (100-199), which again slowly evens out until 999, and so on. So it is always “1” which builds up frequency first, then “2” and so on. Hence, if you pick a random number out of an adequate data set following natural growth patterns, it is by nature much more probable that it starts with a “1” then with e.g. a “2” and so on. And to be clear in mathematical terms, the probability P of a certain digit sequence x being in the first place of a bigger number should follow the equation:

We can observe Benford’s law in many natural phenomena such as rainfall patterns or population distributions. And we can also observe it in financial reporting data. In fact, the numbers in accounting fit very well into the Benford framework: no matter what the size of the company or the industry they are operating.
This, however, is only true as long as the numbers follow actual economic processes and are not somehow artificially classified or altered. This again means that we can use Benford’s law as an indication of whether accounting numbers are based on actual transactions or whether they are somehow (perhaps fraudulently) made-up. The term “indication” is important here. In fact, due to econometric issues it is not possible to state that the conformity with Benford’s law means that the numbers are non-manipulated – nor can we say that the numbers are manipulated if they are non-conform with Benford’s law. But more on this below.
We apply this approach to Steinhoff, the dual-listed (Germany and South-Africa) furniture company that – as a consequence of a PriceWaterhouseCoopers investigation in March 2019 – was convicted of accounting fraud amounting to roughly 7.4 bn USD, sending down the stock price by more than 90%. More specifically, we apply Benford’s law to the disclosed numbers in the 2015-2017 balance sheets of Steinhoff and tried to find out whether these numbers already gave an indication of what later became publicly known. For the analysis below we just took the numbers from Thomson Reuters Eikon and ran our model (a very simple proceeding). These are the results:
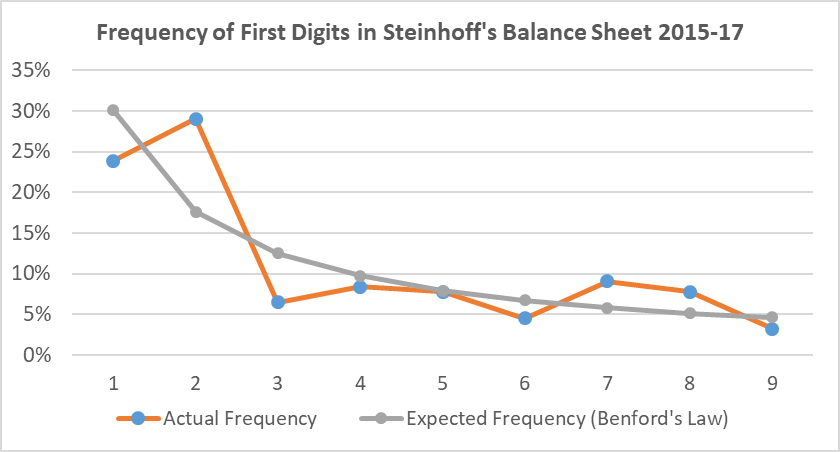
In this analysis we can see that that there is an obvious mismatch, in particular between the positioning of “1” and “2”. But is this enough to state non-conformity with Benford’s law? We applied a test of ‘goodness of fit’ of the two lines – the actual and the predicted one – in order to find out more on this. The typical test for this is the Kolmogorov-Smirnov-Test which has the attractiveness that it can be applied to small numbers of input data (the econometric-afine readers might look over my hands-on approach here). Our analysis shows that the patterns are just NOT significant at the 10% level (meaning – roughly speaking – that we still have to state conformity at a confidence level of 90% but not for slightly lower levels). Additionally, we ran some more analyses which also just missed the 10%-significance level – but were not far away from it – in every single case. So admittedly, the presentation of the results is not very academic – but also not far away from reality. We were always just slightly missing the 10%-level.
So what do we do with the results? Obviously Benford’s law here shows no statistical indication but perhaps a very weak economic indication of manually dressed-up numbers at Steinhoff. With hindsight, however – as Steinhoff has already committed that it dressed-up the numbers – this doesn’t tell us a lot. But if you get similar results in analyses of companies which are not convicted of financial fraud, but are still doing business as usual, this does tell you a lot. In business valuation or investing your job is not to follow any results from statistical analyses. But such econometric analyses should definitely serve as a screen to trigger further analyses. We usually go deeper into fundamental analyses if we spot weaker significance-levels than the roughly 10% of Steinhoff. This is exactly how an analyst should use Benford’s law for analysis – as a trigger for further analyses!
So Benford-analysis is a good tool to spot indications of irregularities? Not necessarily because what I wrote above IS NOT THE END of the Benford-story, not at all! It would be incomplete if we do not set it into the framework of real world developments of these days. And this is certainly an interesting point for fundamental financial statement analysts.
Let’s look at this first from a more general perspective first. Sometimes in finance, effects disappear once they become common knowledge – the buzzword is here: “arbitrage”. E.g. Rolf Banz discovered the effect that small cap stocks significantly outperform large cap stocks – all other things being equal – in 1981 (Banz, 1981, The relationship between return and market value of common stocks, Journal of Financial Economics). But once he found out this effect seemed to disappear in the years thereafter and it is still today at a much lower level (and partially better explained by other factors) than in the years before 1981. This development was the consequence of investors just starting to arbitrage out this anomaly once it became public. So on the good side, Banz has helped to make markets more efficient. On the bad side, he limited the ability to generate outperformance of those investors who knew about this effect before but didn’t talk publicly about it. And this is quite similar to Benford’s law. Now, that it became public knowledge over the years (no, sorry, I don’t tell you any secrets here in this article), also dishonest CFOs are aware of this rule. And if you were an evil CFO, knowing about Benford’s law, how would you make up your numbers? Exactly! You would check the dressed-up numbers for any non-conformity. Because otherwise you would get too quickly caught by Benford-afine, semi-quantitative investors!
Hence from my experience I can tell you that it was easier to spot indications for accounting fraud using Benford’s law in earlier days than it is today. E.g. for Enron (the US energy giant that spectacularly went into bankruptcy in 2001) the analysis usually shows a high significance of non-conformity of the numbers with Benford’s law. And Benford also did not stop at corporate accounts in the good old day. There are research papers which found non-conformity in public data such as the Greek ones at the time they applied for the Euro-zone (e.g. Rauch et al. (2011), Fact and Fiction in EU‐Governmental Economic Data, German Economic Review). And in fact: That Greece helped itself manually with the presentation of the numbers at that time is now common knowledge today. Good job of Benford! But for today’s investment situations? What does Benford tell us? Difficult!
We do not know whether Steinhoff incorporated the idea of masking Benford as part of their fraud. But Steinhoff did not pop up massively in our screens over the years. In fact, if we run an analysis of large indices and want to detect fraud by Benford’s law today we usually get at a 10% significance level roughly 10% of the companies which fall below the conformity level – absolutely in line with what our statistical confidence-level tells us (at a 5% level we get roughly 5%, also absolutely in line with our model). Very, very rarely, we find sufficient evidence of fraud simply by Benford’s law today (but we find a couple of cases where we go deeper into things and indeed find some problems). So Benford’s law has lost relevance over the years. Too bad! Perhaps it is also just a nice gimmick which is no longer applicable in our modern days because too many people know about it.
But stop! This is also NOT THE END of the story of Benford’s law! There is an interesting twist to it (which will perhaps also disappear soon) which is worth one more important anecdote. Once, when we were in the middle of our analyses and scratched our heads about why we couldn’t detect fraudulent companies as easily as in earlier days by applying Benford’s law, we thought about a super-correct, Benford-knowing, but dishonest CFO. How would he mask the dressed-up numbers? Certainly not at a probability of 10% of non-conformity! He would rather mask away everything – so were our thoughts. As a consequence we simply ran our screen again, now checking for super-conformity with Benfor’s law, e.g. where all the numbers match the prediction at a high degree of confidence. And of course here we also spotted some companies. We continued with fundamental analysis for these candidates and (not surprisingly) we found most of the companies being simply caught in our screen by chance. But for one company we exactly found what we were looking for. It turned out that a specific company exactly dressed-up the numbers in a way that does not allow a Benford-analyst to spot it. In the end we found several accounting irregularities in this company with – at our opinion – a high degree of criminal energy of the CFO. As this case is still ongoing, we cannot disclose it here. But it is a very nice example of over-fulfilment.
By the way, criminal investigators have been using this over-positive evidence strategy already for a long time to spot suspicious people. E.g. the German police was looking in the aftermath of the 9/11 attacks on the World Trade Center actively – amongst other criteria – for students who actively paid their fee to the German broadcasting TV authority (the GEZ). This is a mandatory fee which however can hardly be collected by the authority if one does not pay it deliberately. Their thinking was that usually students don’t pay it, but if they do so they have something to hide. They had quite a success with this strategy and – helped by this screen – managed to uncover the so called ‘Hamburg terror cell’.
So what is the message for investors here? Four points are worth mentioning in a summary.
- Always check for Benford’s law if you are suspicious of accounting fraud! It is not too tricky to apply it. Use it as a starting point for further investigations. We are quite sure that you can still spot some indication of irregularities with this tool (and we do it as well).
- Don’t put too much evidence into the findings. They are only a starting point of further analyses. Times have changed over the last years. CFOs also know about this law and if they are dishonest and know it, they will be able to mask it.
- Also look for super-conformers. This is not rarely a similar indication of something going wrong as the non-conformity.
- And finally, the story of Benford’s law is even NOT NOW AT THE END, neither. There are more patterns we look for when trying to detect fraud or aggressive accounting. What is it? I cannot tell you here. Otherwise the story would unfold similar as the simple Benford-story described in this article.