

Since IFRS 15 and ASC 606 took effect for financial years beginning in 2018, the rule should be clear. Whoever sits in the driver’s seat, i.e. controls a good or service before it reaches the customer, is the principal and reports revenue on a gross basis, i.e. including what is passed on to suppliers. Whoever only rides along is an agent and reports net, i.e. only its fee (IFRS 15.B35–B36; ASC 606-10-55-37 to 55-38).
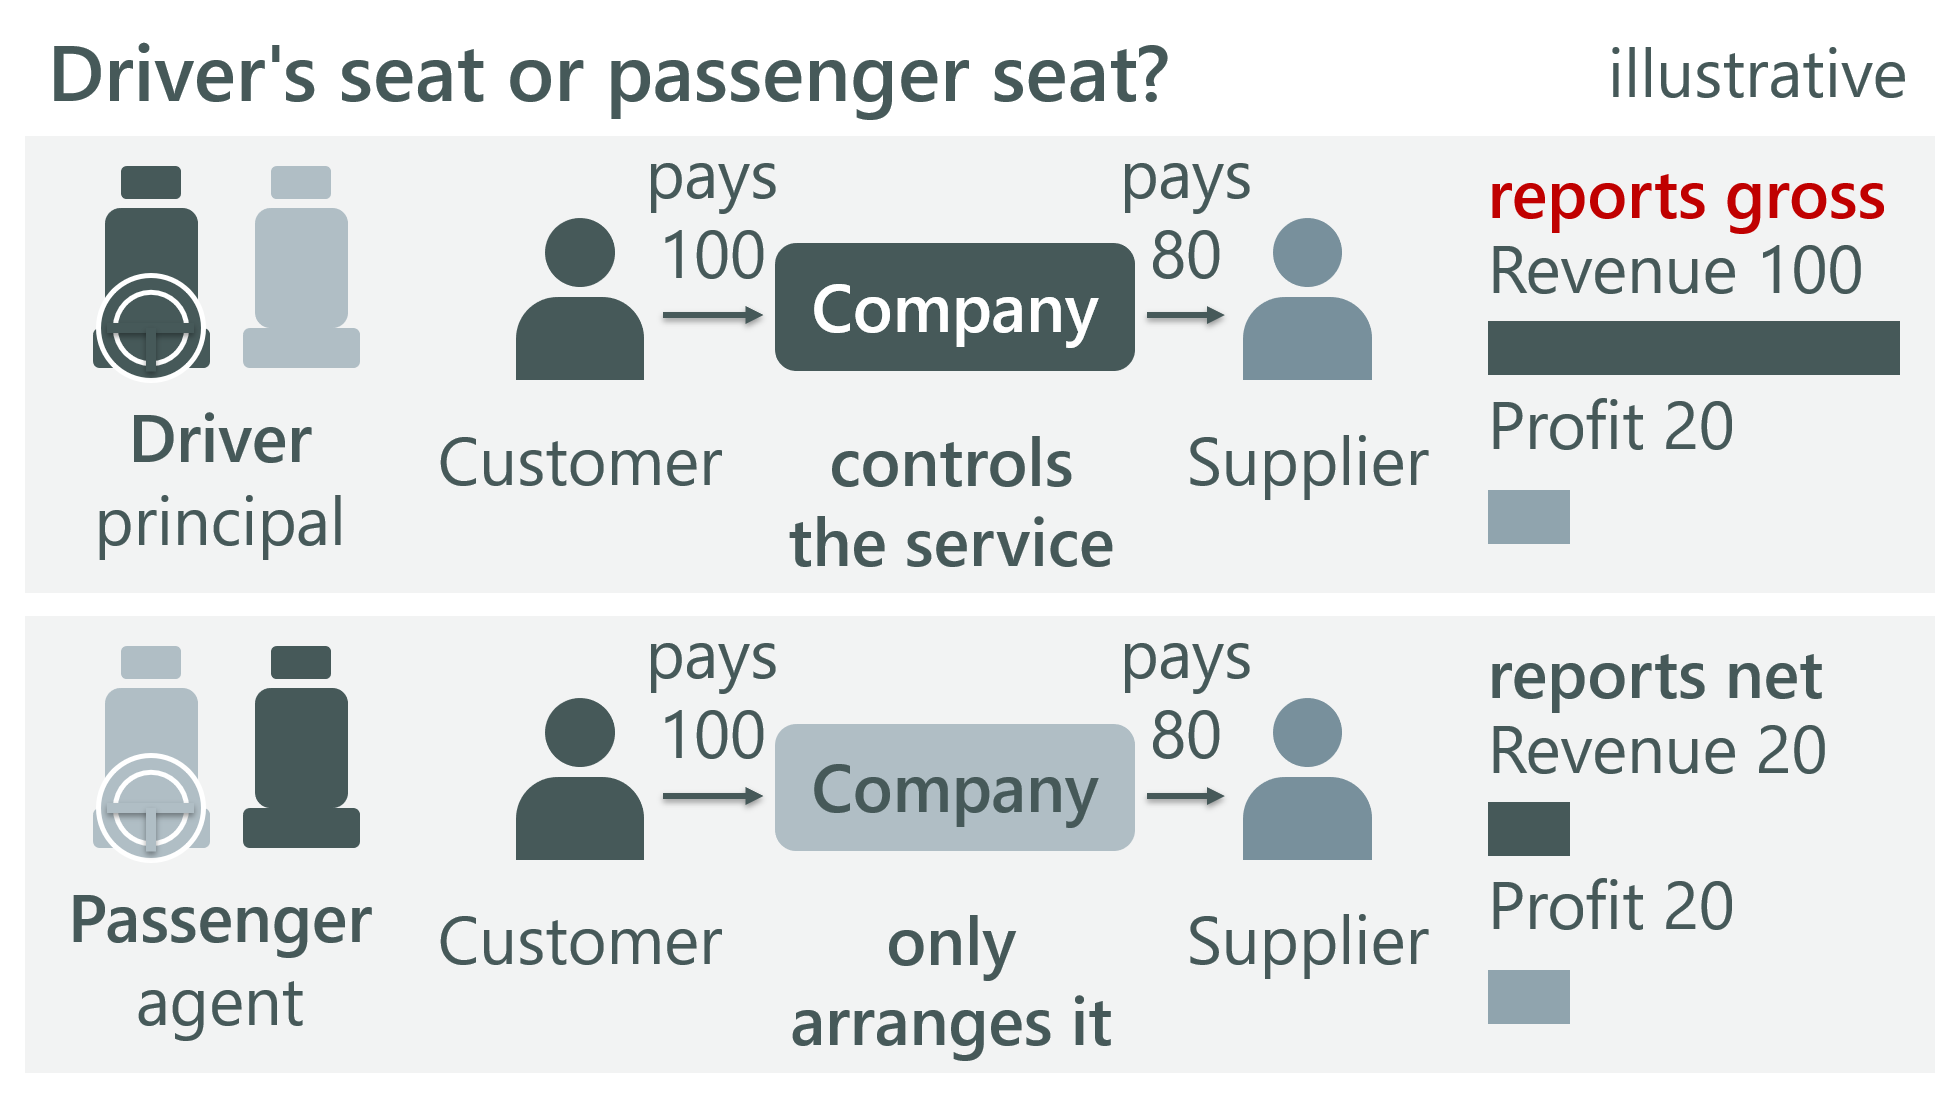
Figure 1 — Gross versus net: who sits in the driver's seat
These rules tamed what had been quite diverse: before 2018, gross versus net turned on risks and rewards rather than control, and IFRS offered little guidance (IASB staff paper, February 2024, para. 6 and Appendix B, para. 48). But anyone who thinks harmonisation means harmony with economic reality is mistaken, as the case of contract research organisations (CROs) shows.
CROs are companies that run clinical trials for drug developers, the "sponsors". Hospitals and their doctors (the "sites" and "investigators") treat the trial patients; the CRO usually pays them on the sponsor's behalf and passes the cost on without a markup, as so-called pass-throughs.
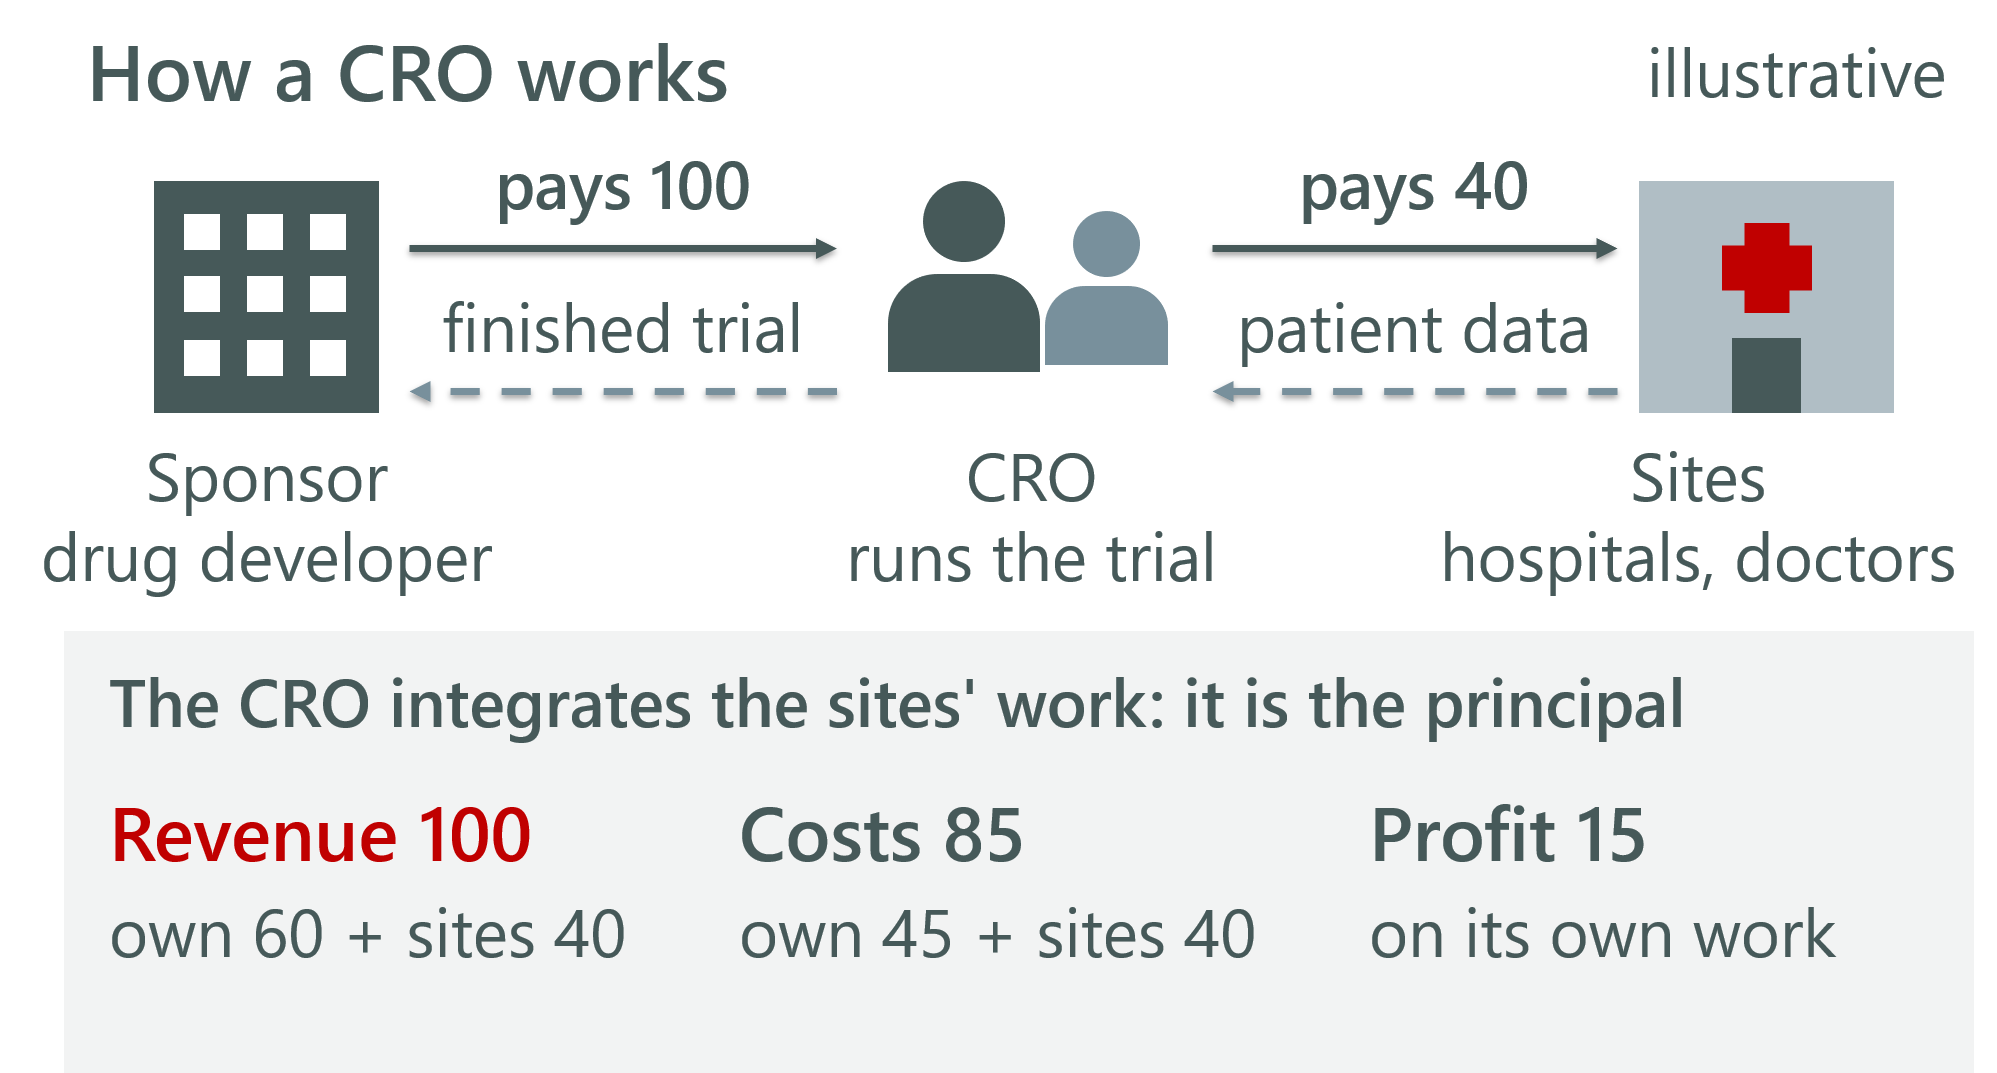
Figure 2 — How a CRO works
Applying IFRS 15 (IFRS) or ASC 606 (US-GAAP), CROs conclude that they control the sites' services, for two reasons:
The CRO promises the sponsor one integrated service, running the trial, as a single "performance obligation".
The doctors' work is only an input into that service. The CRO contracts, pays and monitors the sites and combines their work with its own into the finished trial; such integration means control for the CRO (IFRS 15.B35A(c); ASC 606-10-55-37A(c)).
Hence, under IFRS 15 and ASC 606, the CRO is the principal and reports the fees both in revenue and in costs.
But harmonised gross reporting does not mean economic clarity; in some ways the problems only start here. Or as Ohio-based CRO Medpace's chief executive, August Troendle, put it in April 2026: "Under 606, revenue timing is tough. We have not been great at predicting when pass-through investigator costs will hit." In particular, three problems remain.
Problem 1: profit follows the timing of pass-throughs
Typical CRO contracts run from a few months to several years (Medpace, Form 10-K 2025, p. 53). When deciding which share of a project is finished at year end, most CROs measure progress by cost (cost-to-cost method):
Percentage of completion = costs incurred to date ÷ total expected costs
As the trial is one integrated service in the accounts, the term “costs” covers all costs, i.e. including pass-throughs. So US-GAAP reporting CRO Syneos Health includes "investigator payments and pass-through costs" in that measure (Form 10-K 2018, p. 76); Ireland-based but also US-GAAP reporting CRO ICON uses total project costs "inclusive of third party costs" (Form 20-F 2025, p. 70); CRO Ergomed, which specialises in rare diseases, did the same under IFRS (annual report 2021, p. 86). For Medpace, its auditor confirms that the estimated costs include "reimbursable investigator site payments" (Form 10-K 2025, p. 44). Every cost then carries the same markup, including pass-throughs on which the CRO earns nothing.
The consequence is: while economically the site and investigator costs are just a passthrough, they ride on margin for reasons of financial reporting.
That is harmless if own costs and pass-throughs occur nearly at the same pace. But in reality they don't. Troendle again: in some trials, "you can get halfway through the trial in terms of direct fees … and we haven't paid sites anything hardly” and hence "the pass-through parts of a trial are backloaded" (earnings call, October 2025). PPD, the CRO business unit of Thermo Fisher Scientific, said as much when it went public: including pass-throughs in the measure of progress "may create a timing difference" (Form S-1/A, January 2020, p. 89).
A simple, illustrative example. A trial generates a total revenue of 100: 60 for the CRO's own work, which costs 45, and 40 of investigator (site) fees passed-through at cost. Total cost is 85, total profit is 15. Two-thirds of the CRO's own work falls in year 1, most investigator payments in year 2.
| Year 1 | Year 2 | Total | ||
|---|---|---|---|---|
| a | Own costs of the CRO | 30 | 15 | 45 |
| b | Pass-through costs | 5 | 35 | 40 |
| c | Total costs (a + b) | 35 | 50 | 85 |
| d | Revenue reported (c × 100/85) | 41.2 | 58.8 | 100 |
| e | Revenue earned economically (a × 60/45 + b) | 45.0 | 55.0 | 100 |
| f | Difference (d − e) | −3.8 | +3.8 | 0 |
| g | Profit reported (d − c) | 6.2 | 8.8 | 15 |
| h | Profit earned economically (e − c) | 10.0 | 5.0 | 15 |
| i | Margin on total revenue, reported (g ÷ d) | 15% | 15% | 15% |
| j | Margin on own work, reported (g ÷ (d − b)) | 17% | 37% | 25% |
| k | Margin on own work, earned economically (h ÷ (e − b)) | 25% | 25% | 25% |
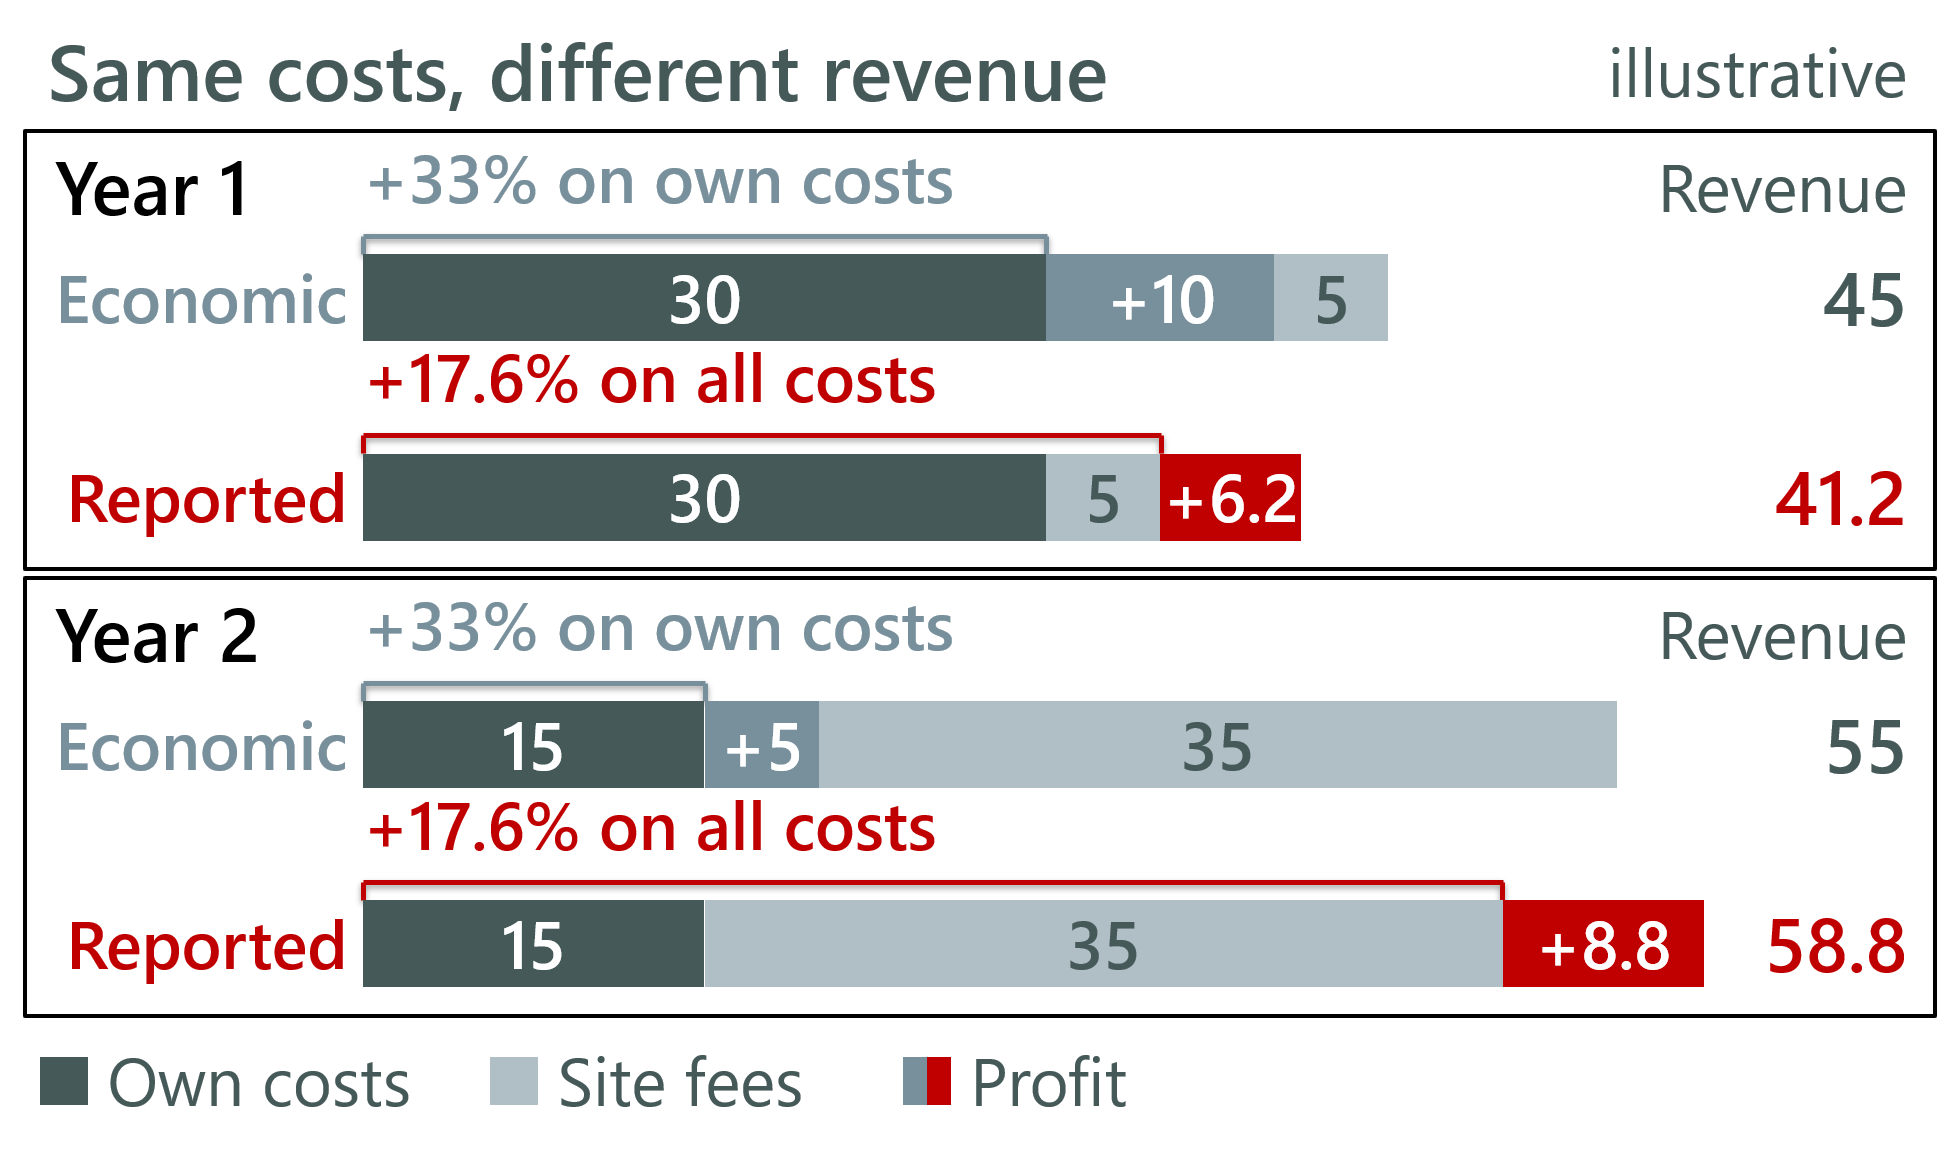
Figure 3 — Revenue in each year: economic view vs reported
The table and the figure highlight the mismatch. In year 1 the CRO has done two-thirds of its own work but reports only 41% of the profit, because reported revenue follows total costs, and only 35 of 85 (41%) have been incurred. As a compensation, in year 2 the late pass-throughs carry a markup in financial reporting that the CRO economically never earns on them (pass-throughs are simply passed through economically), and profit catches up.
Over both years together, the margin is 15% on total revenue ((100 − 85) ÷ 100) and 25% on the CRO's own work ((60 − 45) ÷ 60): the totals are in line with the economics. Period by period they are not. On the CRO's own work the margin is 17% in year 1 and 37% in year 2, against 25% actually earned in every year from an economic point of view; the margin on total revenue, 15% in each year, does not show this variability (row i).
One consequence of this accounting backloading: a CRO with many young trials looks less profitable on its own work than one with many mature trials, even at identical prices. And the good news: cash is not affected, as pass-throughs are typically invoiced as they are incurred (Medpace, Form 10-K 2025, p. 61; ICON, Form 20-F 2025, p. 52).
Problem 2: revenue depends on estimates of other people's costs
At the beginning of each project, total costs are only an estimate, for the CRO's own costs and for the investigators' costs alike. And if revenue follows costs, revenue progress also depends on the estimate of total costs (costs to date plus the "cost to complete"), including investigator fees the CRO does not control.
Medpace states that cost estimates for reimbursable activity, "including but not limited to investigator fee activity, … also influence the Company's assumed contract value and assumed remaining performance obligations", the accounting counterpart of backlog, the signed work not yet performed (Form 10-K 2025, pp. 53–54). Hence, a revised cost estimate moves revenue, contract value and backlog at once. Such changes are changes in estimate (IFRS 15.43; ASC 606-10-25-35), and the effect on work already done is caught up in full in the period of the change.
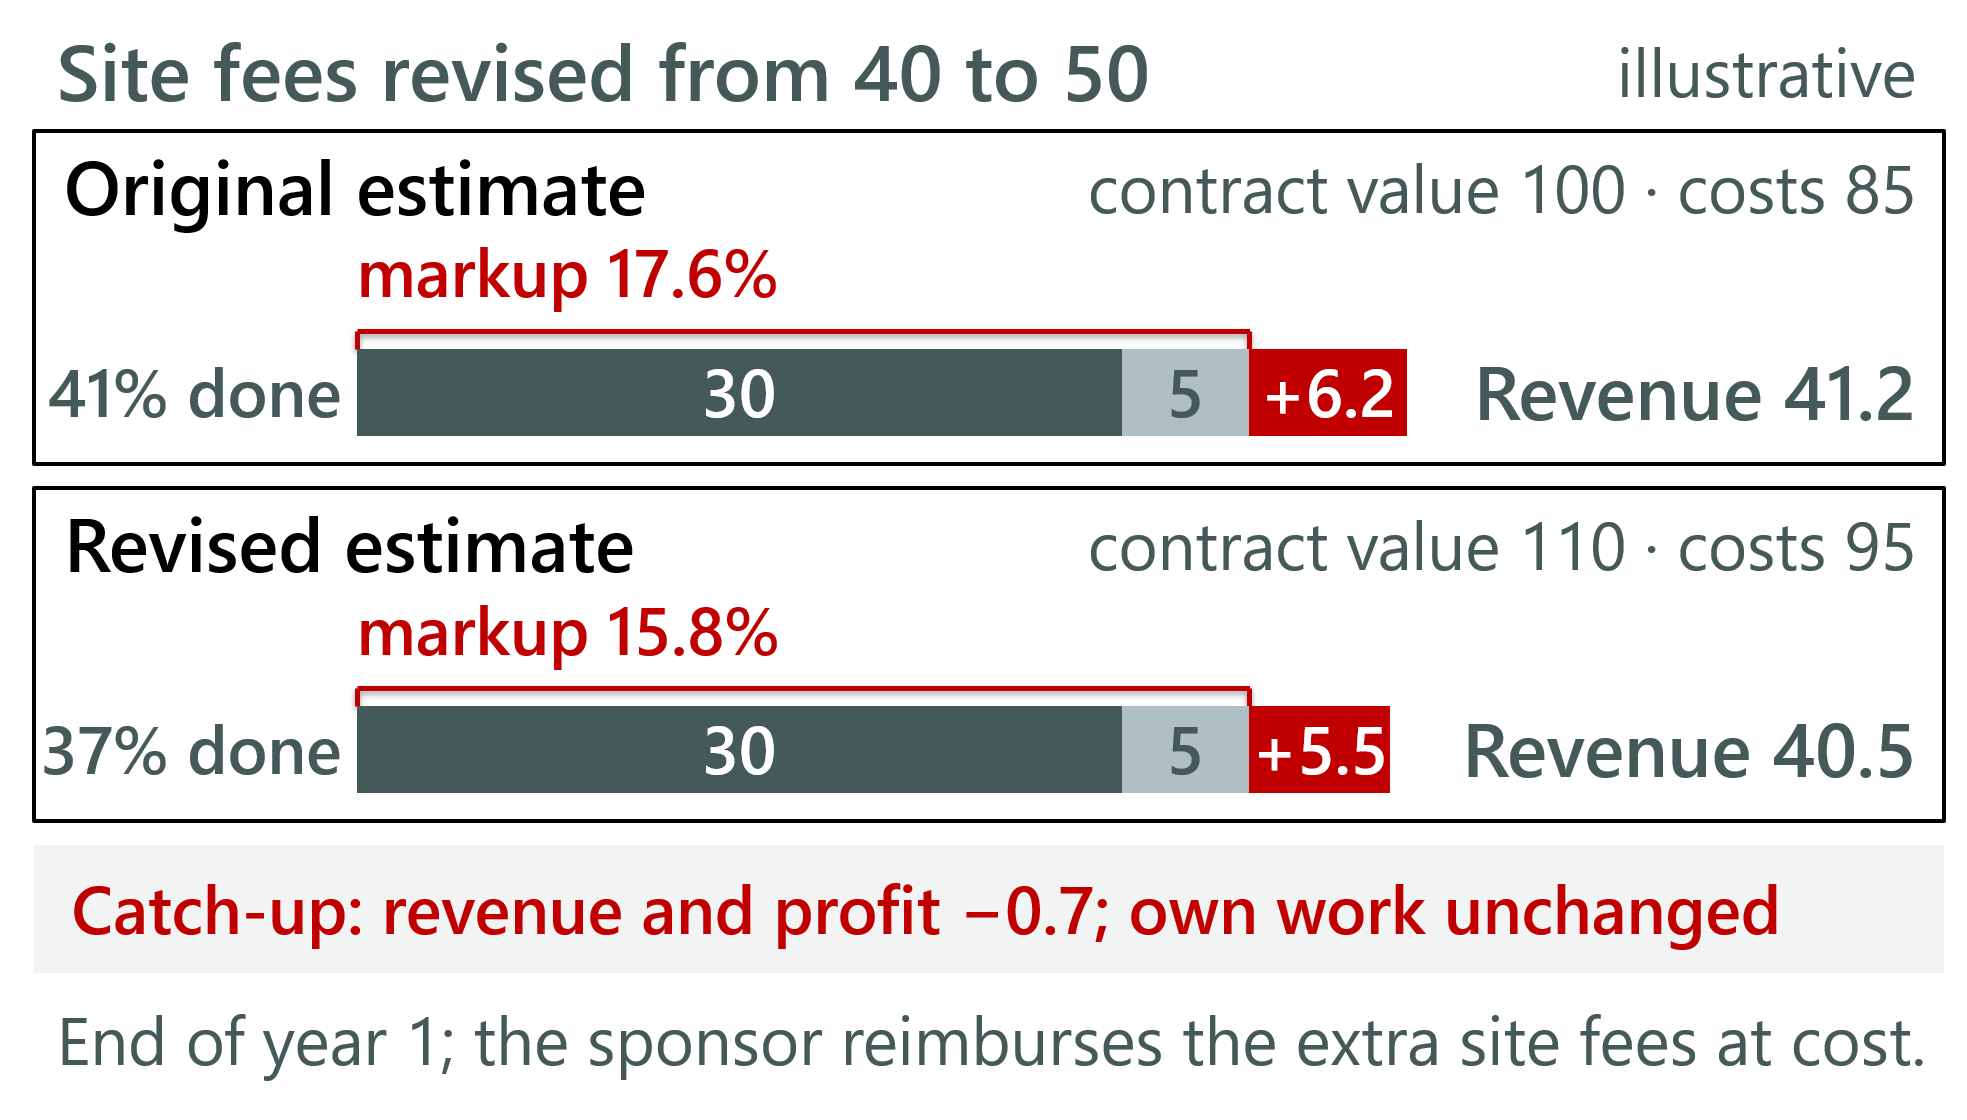
Figure 4 — A revised estimate of site fees
In the example, if the CRO is told that (uncontrolled) total period site fees will be 50 instead of 40 at the end of year 1, contract value and total costs both rise by 10, as the sponsor reimburses the CRO at cost. The share completed drops from 41% to 37%, and the CRO books −0.7 of revenue and profit, although its own work is unchanged.
ICON shows how much depends on cost-to-complete estimates. Its 2025 annual report restated revenue for 2024 by −$92.7 million. Of this, $73.6 million stems from "improper adjustments" and errors in "estimated cost to complete, the assessment of realizable value, and certain manual adjustments"; most of the rest corrects rebates (Form 20-F 2025, explanatory note and p. 120). Importantly, ICON does not link these errors directly to pass-throughs; the point is only that the method that makes pass-throughs revenue also makes revenue an estimate.
One consequence of this dependence on estimates: investors have to look differently at typical KPIs, such as book-to-bill, i.e. new orders divided by revenue. "Book-to-bill is a poor modeling measure under 606," Troendle said in April 2026; a target can be missed "because revenue ran up so fast even if bookings exceeded expectations". The reason: revenue now includes pass-throughs, which arrive late in a trial and can make revenue jump while orders stay strong – in combination deteriorating the book-to-bill ratio.
At Medpace in the first quarter of 2026, orders rose 23.7% and revenue 26.5%, three-quarters of the increase through reimbursed costs; book-to-bill fell to 0.88, from 1.04 in the prior quarter (admittedly in parts because of high cancellations and weaker gross wins, but also driven by the technical pass-through-riding-on-margin effects).
Problem 3: comparability
Even if gross presentation is now uniform, disclosure is not. Medpace shows "Reimbursed out-of-pocket expenses" as a cost line (Form 10-K 2025, p. 48). Fortrea discloses "Pass through costs" of $1,027.6 million (38% of revenue) only in its segment note: its top management reviews the figure, and since 2024 US segment rules require such expenses to be disclosed (Form 10-K 2025, p. 119; ASU 2023-07); before, it gave no amount for pass-through revenue or costs (Form 10-K 2023, p. 51).
IQVIA and ICON give no amount for pass-through revenue or costs in their financial statements (as far as we could find out), although both discuss them with investors. Ergomed showed "Reimbursable expenses" on the face of its income statement (annual report 2021, p. 74), until Permira took it private in 2023. Not easy for investors to find the right basis for comparison.
Two exits from this disharmony: one in the standards, one in the contract
For completeness: within a cost-based measure, the standards contain one escape. Where a cost is "not proportionate to the entity's progress", revenue may be recognised "only to the extent of that cost incurred", at zero margin (IFRS 15.B19(b); ASC 606-10-55-21(b)). But the standards illustrate it only with goods, such as uninstalled materials, and FASB staff describe cost-to-cost as a "levelized margin" applied to every cost (staff memo, June 2018, para. 22). As far as we know, no CRO in this review applies the escape to investigator fees.
However, sometimes contract design matters. Hangzhou Tigermed, a Chinese CRO then reporting under IFRS, said that trial costs it used to pay "on behalf of our customers were increasingly borne by our customers directly". As a result, it books less revenue — "could have certain negative impact on the revenue growth but improves our profitability" (annual results 2020, p. 6). This leads to some sort of between-net-and-gross accounting: where what sponsors pay directly never enters its books. In 2024, however, the company moved to Chinese accounting standards.
Checklist for investors and analysts of CROs
Find the pass-through amount in the income statement, segment note or MD&A.
Find and check the measure of progress of projects. A general (average) progress structure already tells you whether the CRO is still underearning or already overearning
Read the timing of remaining performance obligations. A rising share due within twelve months can mean more trials in the late, pass-through-heavy phase: revenue rises faster than the CRO's own work (Medpace: 55%, after 43% a year earlier; Form 10-K 2025, p. 54).
Forecast costs, not revenue. Own costs follow headcount, pass-throughs follow the stage of the trials; revenue = (own costs + pass-throughs) × (1 + contract markup).
Look for catch-up adjustments from earlier periods and the part due to changes in estimates.
Read book-to-bill with care. When pass-throughs grow faster than the rest of revenue, a falling ratio need not mean falling demand.
Find out who pays the sites. Direct payment cuts revenue but not total profit; it raises the margin and, if site payments come late, brings profit forward.
Summary
IFRS 15 and ASC 606 ended a period in which identical contracts produced net revenue at one CRO and gross revenue at another. That is real progress. But a single performance obligation measured by cost brings three problems: profit that moves with trial timing, revenue that rests on estimates of third-party costs, and disclosures that differ by company. So there is still a lot of own analytical work to do for investors.
No investment recommendation. Just my personal views based on imperfect information. Do your own research.