

Avis Budget Group has delivered one of the most remarkable rallies in recent days. Since 20 March 2026, the stock is up more than 500% (so far). This is one of the most striking textbook short squeezes. But the trigger may not be what many market observers think.
A weak business meets crowded shorts
Let’s start with the fundamentals. Avis is not exactly a poster child for structural growth: a highly leveraged balance sheet, earnings structurally heavily exposed to cyclical travel demand, and pandemic-driven loss of pricing power. In other words: a fragile business model with limited margin for error. Unsurprisingly, short sellers piled in. In the middle of March 2026, many investors expected further downside.
Then came “the squeeze”
However, when the stock started to move up at the end of March 2026, short sellers were forced to react as a) a short position has asymmetric risk: losses are theoretically unlimited and b) shorts can be externally triggered by security lenders who want their shares back. This means: As prices rise, short sellers must cover — i.e., buy back shares to limit losses.
That buying pressure pushes prices even higher → triggering more covering → creating a self-reinforcing loop. This is classic “short squeeze” dynamics.
The “financial engineering” narrative
Some market commentary points to the following trigger for the short squeeze: Hedge funds sold in-the-money put options (at strikes between 110 and 150 USD, with share prices at around 96 USD), forcing buyers to hedge their long-put positions by purchasing the underlying stock, thereby actively initiating the rally.
However, these put options expired on March 20, 2026, without any meaningful price movement up until that date (stock price at that date: 99.90 USD). If hedging flows had been material, they would have occurred before expiration, not after. Yet the rally only started later. So the timeline doesn’t quite fit.
A different explanation: distressed equity dynamics
A more plausible explanation lies in a well-known (but often overlooked) technical phenomenon. Back in 1974, Robert Merton showed that equity in highly leveraged firms behaves like a call option on the firm’s assets. In simple terms: Debt acts like a strike price and equity holders participate only in upside above that level. Downside is capped at zero. This creates convexity.
When a company is in distress (i.e. the enterprise value is close to the nominal value of debt), this convex payoff becomes dominant. And here’s where the volatility paradox comes into play. In the distressed region:
Rising uncertainty can increase equity value (option pricing: limited downside and unlimited upside, vega functional is all positive with maximum at-the-money)
But rising uncertainty can also decrease equity value (risk aversion of investors, systematic risk according to the CAPM framework)
In distress, these opposite risk-effects can partially (or even fully) offset each other and equities in crisis mode not rarely trade in kind of a “risk-neutral zone”, where small changes in expectations can have outsized price effects in both directions.
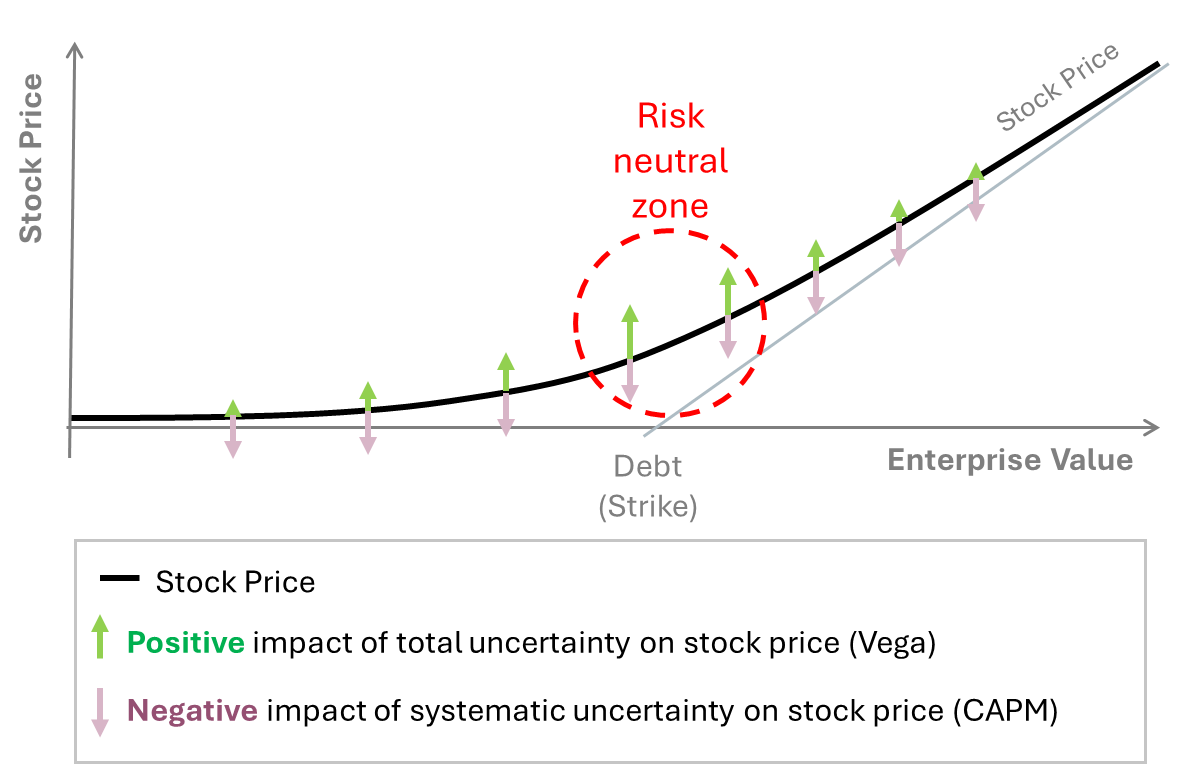
The following figure highlights this. In this figure, the stock price development of a distressed share is depicted on the y-axis and the enterprise value is shown on the x-axis. As equity cannot fall below zero and debt repayment is somewhere in the future, this well known call-option like behaviour results.
In the figure, the green arrows show upside impact of total uncertainty (volatility) while the red arrows indicate downside potential of (systematic) uncertainty (beta * market risk premium). The downside part might look a bit different if you rather believe in factor models than in the CAPM but the overall story does not change: For equities trading at an enterprise value close to the nominal value of debt the up- and down-effects can cancel (or at least soften) each other, so that in this more or less “risk neutral zone” purely for technical terms the share can be tossed-around quite heavily by every new piece of information.
The spark
In Avis’ case, new macro headlines may have been enough to bring the shares into the no-return region: By late March 2026, it became clear that progress toward resolving the Iran conflict was stalling. This involved massive tensions in the Strait of Hormuz, which were expected to lead to more or less severe disruptions to air travel. Some investors interpreted this as bullish for car rentals (substitution effect). Others saw broader downside risks for mobility demand. But in a convex, distressed setup it is not so important, in which direction the fundamental information goes, any movement might be enough.
That was sufficient to push the stock into a “no-return zone” (roughly USD 130–170), where short positions began to crack one by one. As losses mounted, more shorts got uncomfortable, started covering, and added fuel to the rally. From there, it turned into a cascading squeeze. The rest is history.
Summary
Valuing distressed equities is inherently complex. Indirect bankruptcy costs (adverse stakeholder reactions, e.g., customers avoiding a “loser” brand), the ambiguous role of uncertainty, sometimes extreme real-world return distributions and unknown short seller pain points: you get a setup with super high fragility. Not for amateurs, but certainly fascinating to watch.