



Matthias Meitner
mm@valuesque.com
Introduction
SpaceX combines several pre-profit, highly capital-intensive growth businesses whose technological and market outcomes are close to binary. This enormous uncertainty is not a nuisance but rather the central feature of the asset. Where uncertainty is this large and the downside is bounded by limited liability, equity behaves like an option.
This short paper documents the approach and its assumptions. The model takes an external, independent base-case plan and embeds it in an option-style framework solved by Monte-Carlo simulation, so that the uncertainty is represented explicitly. All figures are in USD. The underlying plan is not my plan and I do not recommend relying on it. The calculations in this paper are meant for illustration purposes only.
Base case: the Damodaran SpaceX valuation as a neutral anchor
To keep the base case objective and free of the author’s own discretionary inputs, the publicly available SpaceX valuation by Damodaran (https://aswathdamodaran.substack.com/p/revisiting-the-spacex-valuation-a) is adopted unchanged as the deterministic base case. His forecast is neither re-derived nor modified here; it serves purely as a neutral, externally anchored reference which is available to everyone and around which the uncertainty is modelled. Every stochastic element introduced below is calibrated so that it leaves this base case unchanged. The simulation adds a distribution around the anchor, it does not move the anchor.
A start-up-like high-risk business profile
The base case plan foresees negative free cash flows in the early years, a combination of heavy capital expenditures and sub-scale margins, turning positive only in year 2029. The risk-/cash-flow-profile of SpaceX resembles a young growth company rather than a mature one: a short (or even non-existent) history in the core activities, high fixed costs, front-loaded losses, and even survival questions.
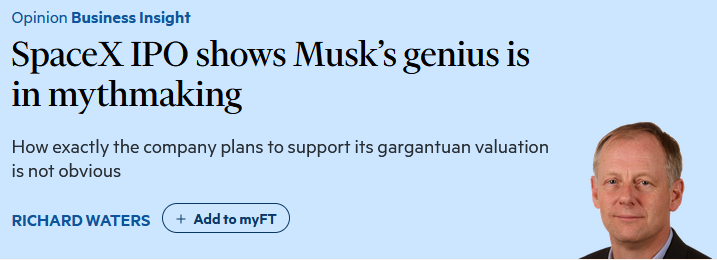
And first and foremost: A huge uncertainty on the structure of future activities. The Financial Times (2026) recently called this high uncertainty narrative in an opinion-article “mythmaking”. It argued that the most striking aspect of SpaceX’ planned IPO is the uncertainty surrounding its future business model. Following its merger with xAI, SpaceX has become primarily an AI-focused company, reflecting Elon Musk’s pattern of reshaping businesses to match investor enthusiasm. Critics see this as opportunistic, while supporters view it as visionary. The company’s growth story now hinges on the ambitious but highly speculative prospect of space-based AI data centres.
Making uncertainty explicit by Using Monte Carlo Simulations
Following the basic idea of the proceeding of Schwartz/Moon (2000, 2001), the static base-case plan is overlaid by Monte-Carlo simulation (Boyle, 1977). The technique: revenue is modelled as a stochastic state variable; 250,000 independent ten-year revenue paths are drawn from the assumed process; on each path the model computes EBIT, taxes (with no tax shield on losses), reinvestment, free cash flow and a terminal value, applies the default rule of Section 6, discounts the path-dependent cash flows to determine the path-dependent enterprise value. The ultimate enterprise value is the average across paths.
Uncertainty is handled in a risk-neutral framework rather than by an ad-hoc premium in the discount rate. In a risk-neutral framework the expected growth rate of the state variable is risk-adjusted, with the resulting cash flows being discounted at the risk-free rate (Hull, 2021, p. 805). We perform the risk-adjustment on the revenue level by applying the following (certainty-equivalent) periodical drift (Meitner/Streitferdt, 2014).
Here is the real-world expected growth rate in period t (taken from the Damodaran static DCF model) , the market price of risk, the correlation coefficient of revenues with the market portfolio, and the revenue volatility (see section 5 on how it is calibrated).
The resulting risk-adjusted revenues form the basis for the derivation of the risk-adjusted free cash flows. These risk-adjusted cash flows are then discounted at the risk-free rate.
The broad equity market price of risk sits historically around 0.3 to 0.4. And the average stock/market correlation is at roughly 0.6. We use these values as input for our model (admittedly, we can do better in terms of calibration of the model here, but for illustration purposes this is enough). The revenue volatility is applied period- and segment-specific to our model (more on this in the next section).
Modelling the uncertainty: volatility process and distribution
Each revenue category carries its own uncertainty, highest for the youngest and least proven segments. The model adopts the Schwartz–Moon deterministic volatility decay: the revenue volatility starts at , and reverts with the mean reversion coefficient k toward a long-run level ,
(see Schwartz/Moon, 2001, eq. 28; their calibration for the valuation of eBay uses = 0.167 reverting to = 0.083, with translating into a 2.8-year half-life because ). The idea of this volatility decay path is that high risk start-up-like business models mature over time. This maturity process comes along with derisking of operations.
In our model, we also apply a 2.8-year half-life, i.e. . Segment volatilities are blended by revenue weight into the aggregate path used in the simulation.
For these given path economics for volatilities, we then backward-search starting volatilities such that the valuation result resembles the Damodaran base case result. The table below shows these assumed annual volatilities per category over time. Uncertainty compounds, so the statistical cumulative ten-year volatility is , and the cumulative ten-year drift adjustment factor is
| Segment \ Year t | 1 | 2 | 3 | 4 | 5 | 6 | 7 | 8 | 9 | 10 |
|---|---|---|---|---|---|---|---|---|---|---|
| Launch | 30.0 | 26.3 | 23.5 | 21.2 | 19.5 | 18.1 | 17.1 | 16.2 | 15.6 | 15.1 |
| Starlink | 41.7 | 36.2 | 31.8 | 28.5 | 25.9 | 23.8 | 22.2 | 21.0 | 20.1 | 19.3 |
| xAI | 75.0 | 64.0 | 55.3 | 48.6 | 43.4 | 39.3 | 36.2 | 33.7 | 31.8 | 30.3 |
| Other ventures | 91.7 | 78.1 | 67.4 | 59.2 | 52.7 | 47.7 | 43.8 | 40.7 | 38.4 | 36.5 |
| Blended (rev-wtd) | 50.8 | 45.3 | 39.9 | 35.4 | 31.8 | 30.8 | 29.1 | 27.6 | 26.2 | 25.3 |
Table 1: Assumed annual revenue volatility σ(t) by segment and year in %
As already mentioned, the volatility level is not a free parameter. The overall scale of is calibrated so that the deterministic base case reproduces the Damodaran reference valuation used as the anchor. The Monte Carlo simulation’s risk parameters are thereby tied to an external, independent valuation rather than chosen freely.
Regarding the revenue distribution assumption, we modelled the cumulative deviation of revenues for reasons of simplicity as normally distributed (arithmetic) around the base case revenue and truncated at zero,
The normal distribution keeps the mean of the base case plan and avoids the pronounced right-skew of the lognormal. The truncation at zero prevents economically nonsensical negative revenue.
Cost structure, operating leverage (φ) and default
Costs are split into a variable component proportional to revenue, , and a fixed block , in general following the Schwartz–Moon (2001) cost function,
where the fixed share is set to 60%. The split is calibrated to leave the deterministic base case unchanged; it governs only how strongly profit reacts to revenue surprises; i.e. the operating leverage.
The SpaceX S-1 does not disclose a fixed/variable breakdown, so cannot be read off directly and has to be estimated from the cost structure. On the FY2025 figures with revenue of roughly 18.7bn USD against an operating cost base near 20bn USD (cost of revenue ≈ 11.4bn USD, R&D ≈ 6.8bn USD, SG&A ≈ 1.9bn USD) only a minority of cost is genuinely variable in the short run.
In the Launch segment, propellant, mission-specific hardware and bought-in parts scale with activity, but launch pads, manufacturing and engineering capacity do not; in the Starlink segment the incremental cost of an additional subscriber is small while satellite production, ground stations and depreciation dominate (which is why the connectivity segment already runs near a 39% operating margin on roughly 61% of revenue); and in the AI segment the data-centre, GPU, power and research cost is incurred largely irrespective of incremental usage. According to this (admittedly incomplete and only cursory) analysis, a rough cost decomposition looks as follows:
| Cost type | Estimated share of the operating cost base |
|---|---|
| Fixed | 50–60% |
| Semi-fixed | 15–20% |
| Variable | 20–30% |
Table 2: Indicative decomposition of the operating cost base (own estimate).
This puts the fixed-plus-semi-fixed block on the order of 65–80%. For reasons of a generally increasing variability of costs in the long run we have set the fixed cost share at 60%. It is worth noting that the fixed cost intensity of SpaceX is well above a classic industrial firm and closer to a satellite-network operator, a telecom, or a hyperscaler than to a launch-vehicle manufacturer.
One caveat here: A large part of today’s spending is presented as temporary growth investment (Starship R&D ≈ 3bn USD, AI R&D ≈ 1.9bn USD and AI capex ≈ 12.7bn USD) on the implicit assumption that it normalises later. To the extent these items are in fact structural features of the business rather than transitory, the true fixed share is higher still and is a more conservative choice.
SpaceX high operating leverage is what makes early losses and downside default endogenous in the simulation. Default itself is modelled through limited liability, in the structural-credit tradition of Merton (1974): equity is a call option on the firm, so its value cannot fall below zero, and a path whose terminal economics are negative is treated as default with equity value of zero.
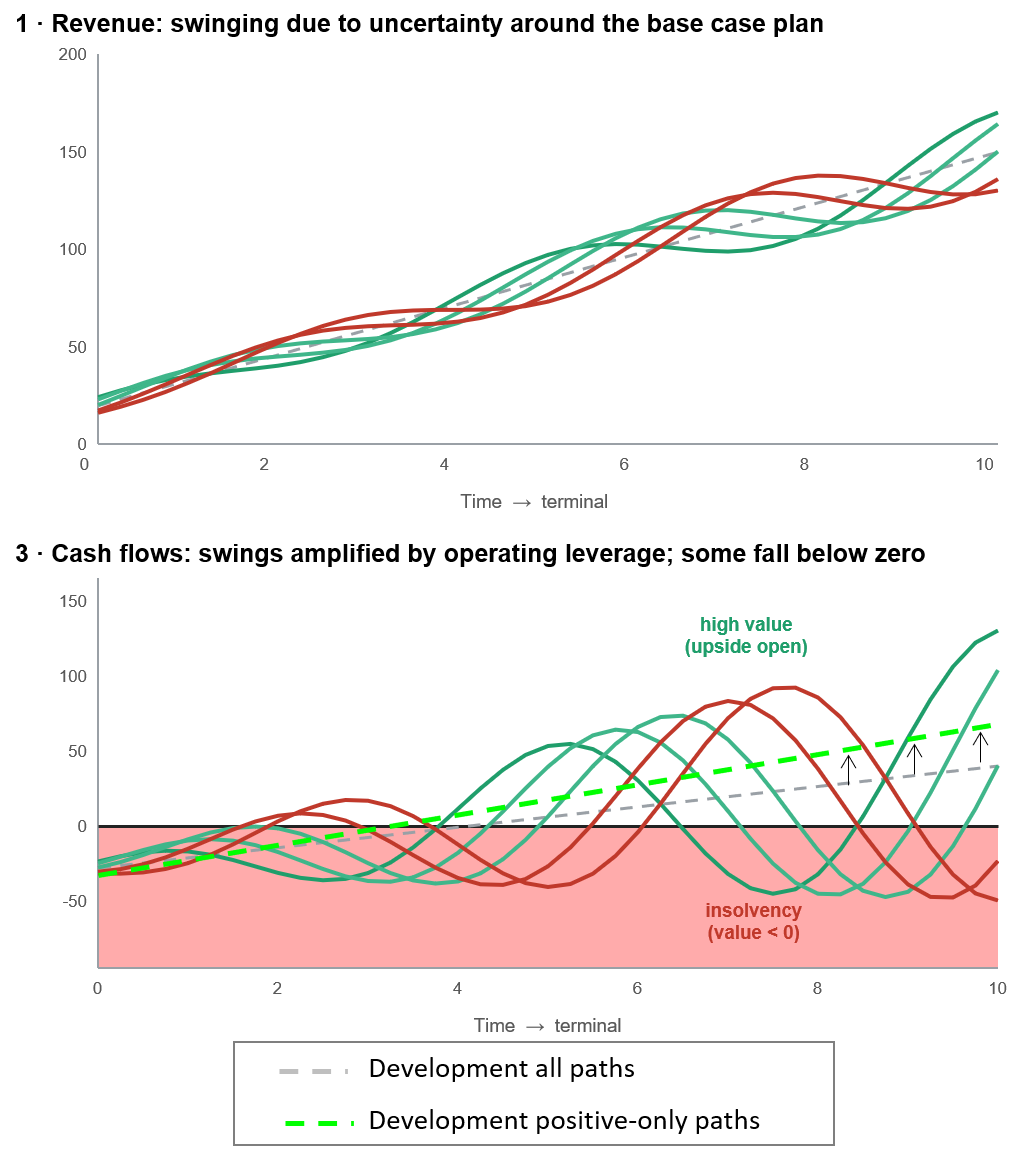
Figure 1: Explanation of the option effect in the valuation model
Simulation results
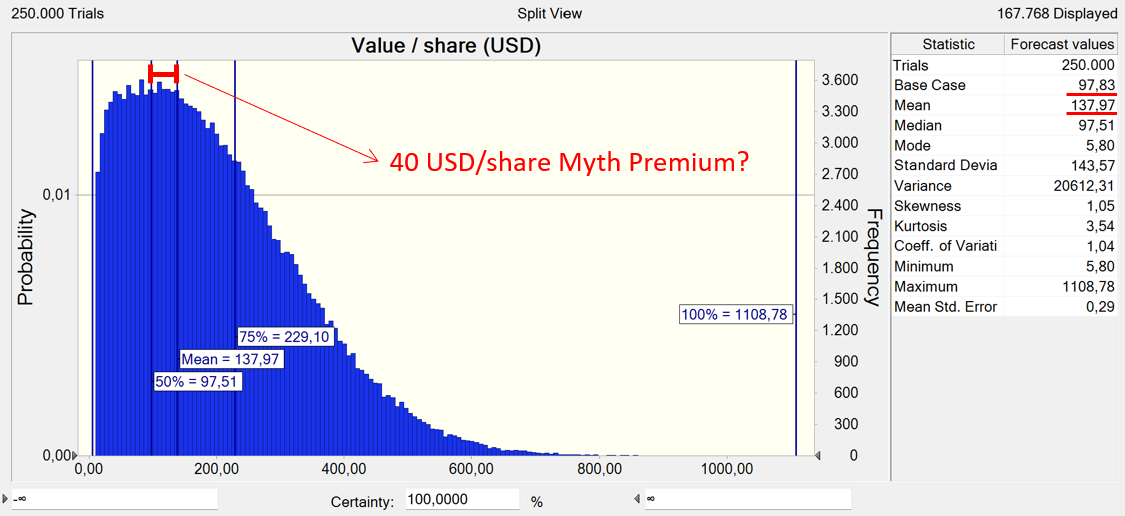
At the calibrated volatilities and fixed cost levels the model produces a base case value per share of ≈ 97.83 USD (in line with the Damodaran static base case), but a simulated mean value per share of ≈ 137.97 USD (on a 10-year cumulative default probability of roughly 33%). I.e. the simulation case shows a premium of 40 USD/share vs. the base case.
The simulation shows an asymmetric picture with the mean exceeding the median (the signature of the limited-liability asymmetry combined with operating leverage) and the downside being truncated at zero while the upside remains open. We ran 250,000 trials in order to get stable results.
Two regions characterise the value per share distribution (Figure 2 including zero or near-zero values; Figure 3: excluding zero or near-zero values):
a) roughly one path in three in which the firm becomes uneconomic and equity is wiped out at some point over the next 10 years (default paths). The default paths are the consequence of the combination of the high initial risk profile (high uncertainty, reducing over time), the high operating leverage and the unfavourable initial cash flow profile.
b) a large body of more or less symmetrical outcomes with a thin upper tail of very high outcomes where sustained high growth compounds favourably.
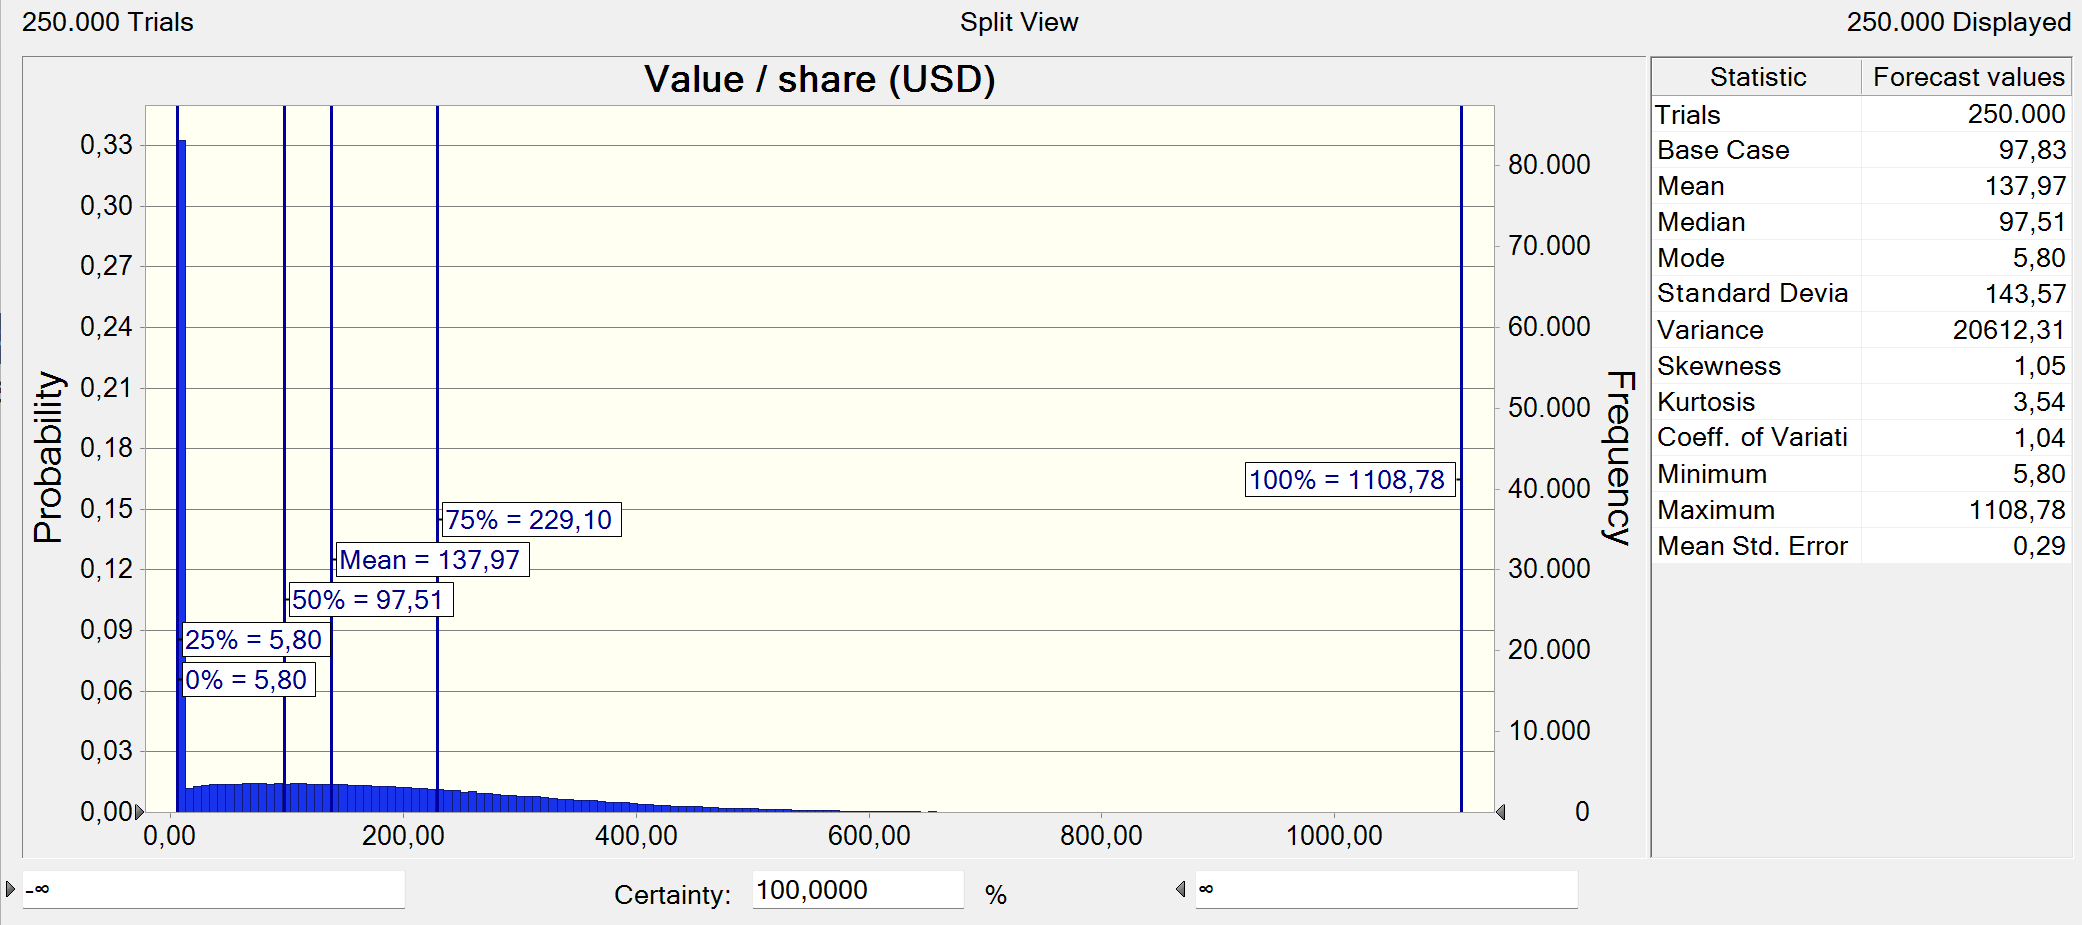
Figure 2: Simulation results including zero (software: Oracle Crystal Ball)
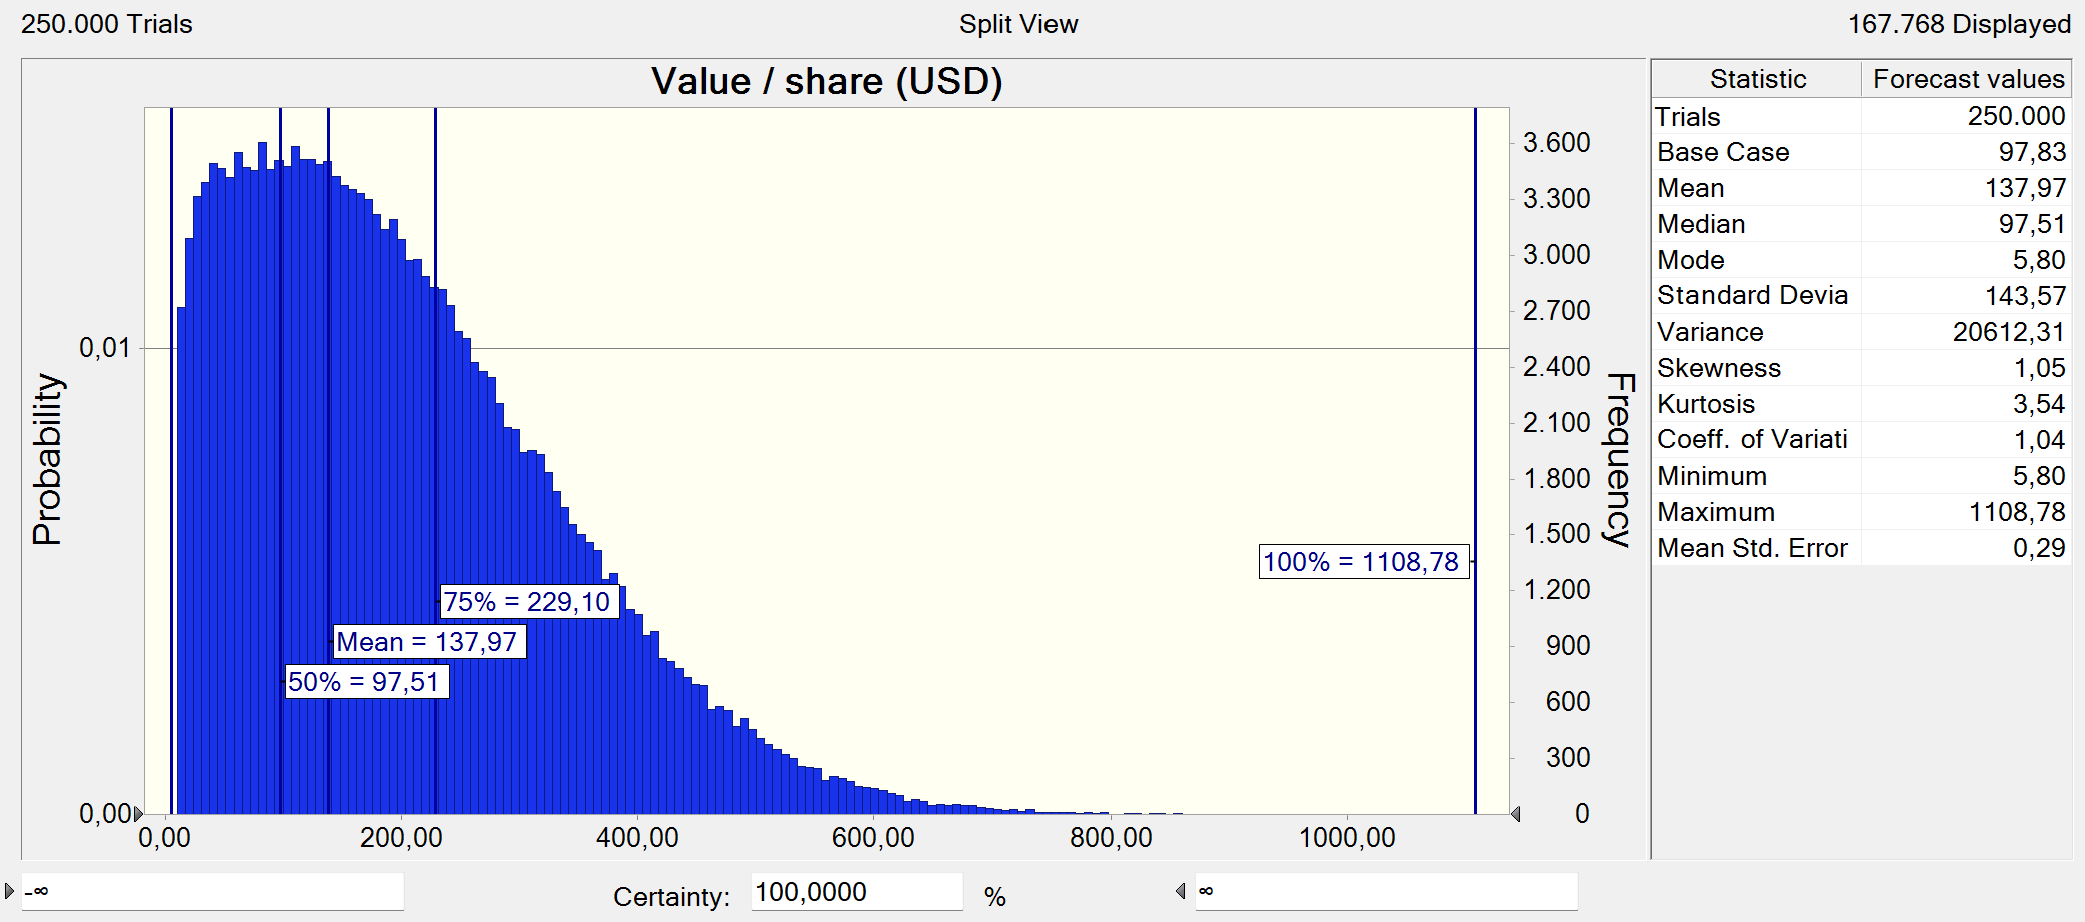
Figure 3: Simulation results excluding zero (software: Oracle Crystal Ball)
In total, the results show that due to the character of the business model uncertainty can have a positive impact on the value (similar to a financial call option). When the Financial Times calls this active uncertainty creation “mythmaking”, we would call the premium above the static DCF value the “Myth Premium”. In our valuation exercise the Myth Premium is at ca. 40 USD/share. In our model, this premium is enough to lift the fair value per share from the Damodaran static DCF-value of ca. 98 USD/share over the target listing price of 135 USD/share to 138 USD/share.
The results are – in non-financial terms – comparable to a FOMO behaviour of capital market participants. Even if it is not highly probable that the share price skyrockets like the business model, the sheer possibility paired with the limited downside drives the value here.
Caveats to our Analysis
This analysis is just a technical valuation exercise that should emphasize the potential positive impact of high uncertainty in startup-like valuation cases. The analysis is not based on an own thorough fundamental analysis. It is built on an already existing and for everybody freely available DCF-model (the Damodaran model) in order to objectify our valuation exercise. We did not check the appropriateness of the assumptions in the Damodaran-model.
The relatively high percentage of default paths is the result of the technical setting of the model. By no means do we want to make a statement about real world default probabilities of SpaceX. Moreover, default is modelled in a rather simple way (no positive sustainable free cash flow in the model). The model results are also highly dependent on the chosen distribution assumptions.
Even if there is a Myth Premium, it might quickly disappear once uncertainty resolves.
This whole analysis is not an investment recommendation but rather an illustration of value effects.
Do your own research!
References
Boyle (1977). Options: A Monte Carlo Approach. Journal of Financial Economics, 4(3), 323-338.
Damodaran (2026), Musing on Markets, Revisiting the SpaceX Valuation: A Post-Prospectus Update, 5 June 2026 (https://aswathdamodaran.substack.com/p/revisiting-the-spacex-valuation-a)
Financial Times (2026), Opinion Business Insight, Richard Waters, SpaceX IPO shows Musk’s genius is in mythmaking, 4 June 2026 (https://www.ft.com/content/625ae455-3b7b-454e-82f3-b22414459cc0?syn-25a6b1a6=1)
Hull (2021), Options, Futures, and Other Derivatives, 11th edition. Pearson.
Meitner/Streitferdt (2014). DCF-valuations of companies in crisis. Distress-related leverage, identification of risk positions, discounting techniques, and "beta flips". Journal of Business Valuation and Economic Loss Analysis, 8 (1), 145–174
Merton (1974). On the Pricing of Corporate Debt: The Risk Structure of Interest Rates. Journal of Finance, 29(2), 449–470.
Schwartz/Moon (2000). Rational Pricing of Internet Companies. Financial Analysts Journal, 56(3), 62-75.
Schwartz/Moon (2001). Rational Pricing of Internet Companies Revisited. The Financial Review, 36(1), 7-26.