Preface: I know that there are some readers who are mainly interested in accounting topics. And those will be served by this post, too, as the equity premium is also a very hot topic in accounting these days. But for getting there, you have to read through till the end… 🙂
Furthermore, this blog post serves as an add-on to our former post on the cost of capital during the coronavirus crisis (HERE)
In 1985 Rajnish Mehra and Edward Prescott shocked the financial academic community with their article “The Equity Premium: A Puzzle” ( Journal of Monetary Economics, 15 (2), pp. 145-162). Until then, the level of equity risk premia could more or less be explained by the volatility of stock market returns if one assumes a quite reasonable degree of risk aversion. However, Mehra/Prescott stressed that it is not stock prices that matter for deriving utility functions of individuals but rather consumption – and consumption volatility is much lower than equity volatility. And if we substitute stock market volatility by historical consumption volatility in our explanatory model, we would end up with a reasonable equity risk premium of about 0.2 to 0.4 percent. This is lower roughly by the factor 25 than what academics and investors saw as reasonable at that time or could measure from past data (ca. 7.5%).
Today, we have several explanations for this equity premium puzzle (although not everything can be explained). And hence we again feel quite comfortable to look at the stock market when trying to derive equity risk premia – in particular if it is about practical valuation cases. However, the massive distortions that the coronavirus-crisis brought to international stock markets has raised again lots of questions what this development means for the equity premium. And this is not only a question that serveral investors ask, to find a good answer is also of utmost importance for auditors these days – because 31 March 2020 is the big Q1/2020-impairment testing reference date! This is why, in this blog post, we provide a bit of background on how to find out where equity risk premia have gone in the last weeks, and on why perhaps not everybody is happy with this development.
Starting point is to look at what the equity premium actually is, and how the current coronavirus-crisis has impacted it.
What is the Equity (Risk) Premium?
The Equity Premium is the percentage premium that investors require (over and above the risk-free rate) for taking stock market risk. It is a forward-looking measure and it depends on two factors: first, the degree of risk aversion of average market participants – the higher the risk aversion, the more premium is required for a given amount of risk. And second, the riskiness of the stock market (assuming that stock market risk is relevant here, and not consumption risk as Mehra/Prescott stated).
Assuming that the general risk aversion has not changed (or at least not decreased) in recent weeks, the equity premium should have increased recently as – and there should be no major doubt about it – the uncertainty of the stock market has massively increased.

Or putting it in more formal terms: the risk premium required per unit of market risk is called the “market price of risk λ” (Fama 1968, Risk, Return, and General Equilibrium: Some Clarifying Comments, Journal of Finance 23 (1), p. 35). It is calculated by dividing the market risk premium by the variance of the stock market returns σRM2:
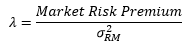
For a stable market price of risk we finally get the formal relationship between the equity premium (or market risk premium) and the stock market uncertainty, measured in terms of the variance of stock returns:
![]()
Historical Data Method
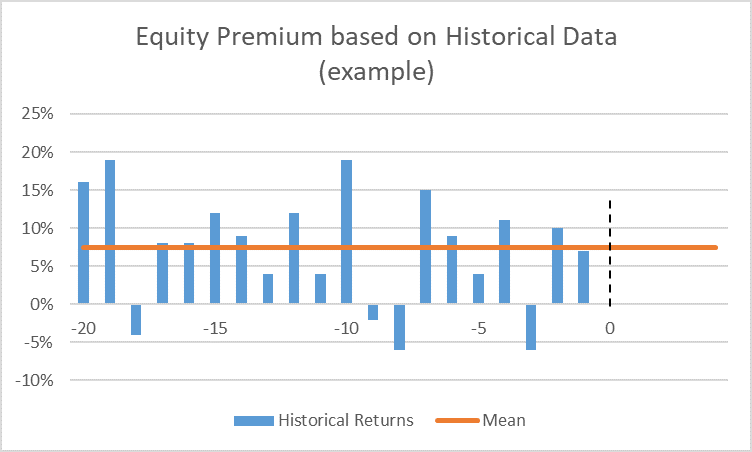
This approach is as old as the stock markets although – to our knowledge – the first structured analysis was only published in 1976 (Ibbotson/Sinquefield, The Journal of Business, 49 (1), pp. 11-47). The basic technique is very simple: It is about determining the average historical outperformance of annual stock returns over government bonds (as a proxy for the risk free rate) over a certain time period and taking this realized average investment premium as the measure for the future. Admittedly, real life application of this technique requires a bit more than just comparing the naked returns (i.e. some statistical adjustments for some biases in the data) but this is usually manageable.
But remember that the equity premium is a forward looking measure! Hence, as a matter of course, the historical data technique is a reasonable way of determining equity premiums ONLY if the past is somehow representative for the future. In times of structural breaks or other changes of the market environment it does NOT make sense to use this technique. And the coronavirus crisis is a perfect example of such a sudden change in the market environment.
Implied Risk Premia
The idea of implied equity premia is to get rid of any historical perspective and only focussing on the future – thereby overcoming the main problem of the historical data method. The basic technique is to set up a valuation model, fill it with measurable data and assumptions, set it equal to the value of a stock market index, and then solve it for the only variable that is unknown: the equity premium. In very simple terms it works as follows:
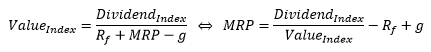
With MRP: Market Risk Premium (Equity Premium), Rf: Risk-free rate, g: growth rate.
In reality, the models do not look that simple. Rather, they often contain a detailed planning period which is filled with sell-side analyst estimates, before entering into some sort of the above terminal value formula.
In such implied risk premia models, the advantage of not being dependent on the past anymore is bought at the price of being exposed to some rather fragile assumptions, in particular to the quality of analyst estimates and to the long-term growth rates. Nevertheless, these models are often seen as superior to the historical data models if capital markets are rather unstable. However, in times of sudden and major changes in the market environment they also have their weaknesses – mainly related to the slow reaction times of analysts.
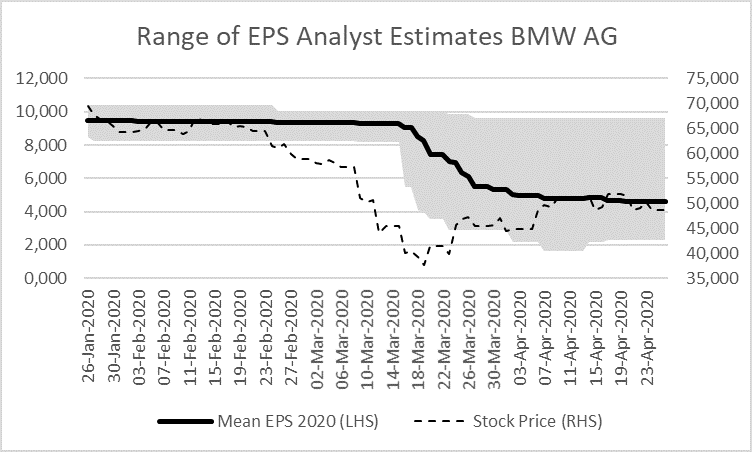
First, some analysts simply do not adjust their earnings (as a basis for dividends) estimates fast enough. This is shown by the Reuters-Consensus estimates for German car maker BMW AG at 24 April 2020. The black line is the consensus (average) estimate of analysts, the grey area depicts the range of all estimates (low to high). As can be seen, not all analysts have adequately downward adjusted their estimates to the coronavirus crisis (the upper limit is still very high) even more than two months after European stock markets showed first reactions.
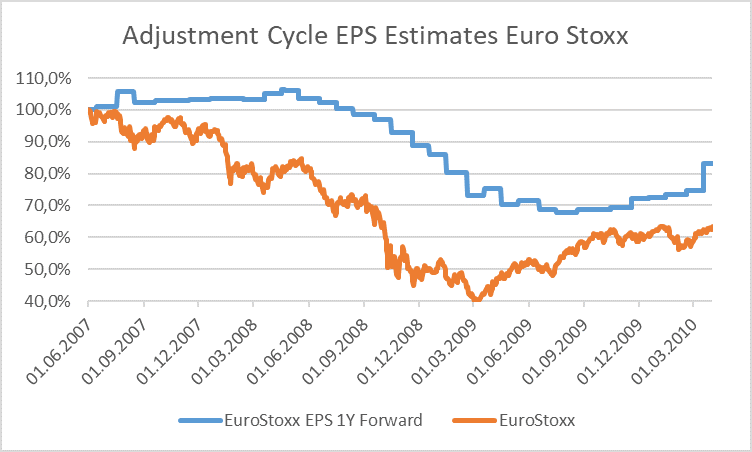
Second, even if analysts react quickly they usually need time to fully process all the information and get to the final earnings estimate. The result is that usually the earnings adjustment process follows a gradual path and takes quite some time until the equilibrium is reached. This is shown below by the adjustment cycle for earnings-per-share for the EuroStoxx during the financial crisis years 2007 to 2010. Here, earnings estimates clearly lag stock prices and reach their low only several months after the stock market trough.
Implied risk premia models are hence at least in the starting phase of a market shakeup (and we are certainly still in this starting phase at the time of writing this blog post) not the best models to determine reasonable equity premia – although they are currently certainly better than historical data models.
Volatility-adjusted Risk Premia
The best ways for determining risk premia in times of sudden change are volatility adjustments. This approach does not allow to independently determine risk premia (such as the other two here discussed ones) but rather requires a starting risk premium for the time just before the coronavirus crisis and then adjusts this starting premium for changes in volatility. While the fast reaction time of this approach makes it a very strong tool in the beginning of a crisis, it will not be our preferred model of choice for a long-time as it only serves as an adjustment tool and not as a stand-alone model.
Based on the above stated equation for the market risk premium as a function of the market price of risk and the variance of stock returns, and assuming that the market price of risk stays constant, we can model movements in the market risk premium (equity premium) as a function of movements in stock return variances.
For measuring the expected fluctuations in stock returns we can rely on implied volatility indexes that basically exist for all the bigger market indexes. These indexes give a measure for the volatilities, i.e. the standard deviations, of stock returns that are implied by options on the index. Concretely, the VSTOXX measures the implied volatilities of a basket of EURO STOXX 50 index-options which are either trading “at the money” or “out of the money”. The VSTOXX exists for times to expiration of 30 days as well as 2, 3, 6, 9, 12, 18 and 24 months. Hence, at each and every date we can measure volatilities for different future time horizons. This allows us to derive a “term structure of volatilies”. Below we show these term structures for a 2-year and a 10-weeks observation period. The right axis shows the times-to-expiration (1-24 months) and the vertical axis shows the volatilities.
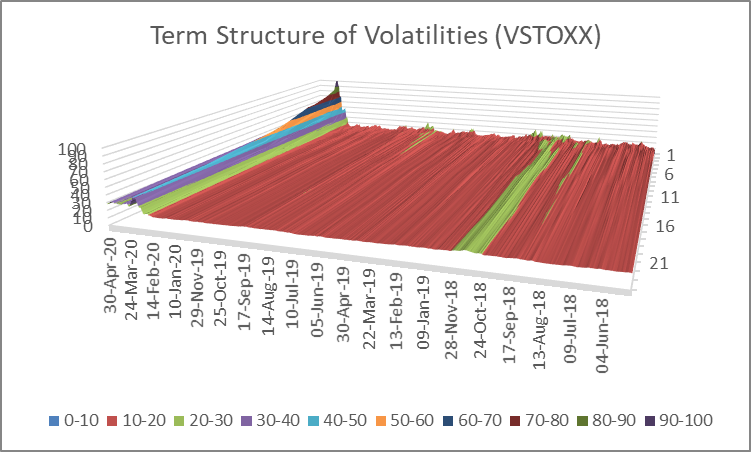
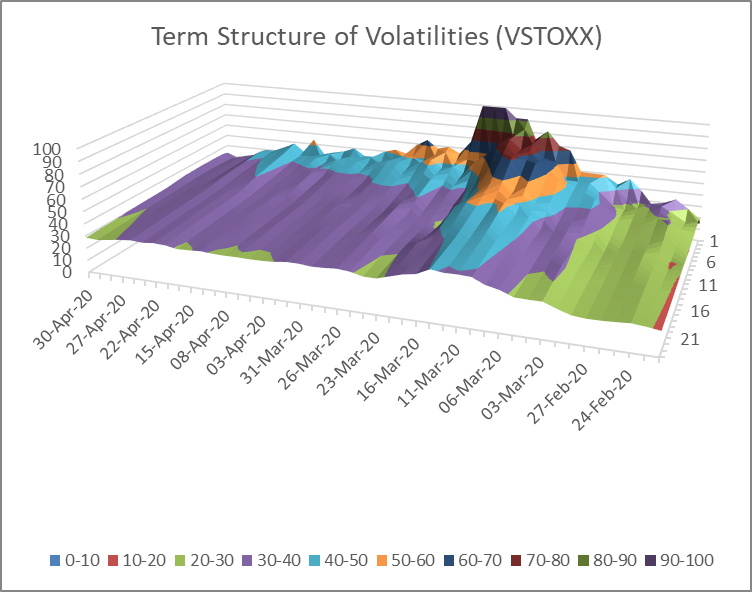
From this graph we can see two important things. First, the peak of implied volatilities seems to be behind us – at least for now. Second, the volatility term structures are basically all in backwardation, i.e. the short-end volatilities are higher than the long-end volatilities. The latter rather implies that market participants expect a hefty but not a long-lasting crisis.
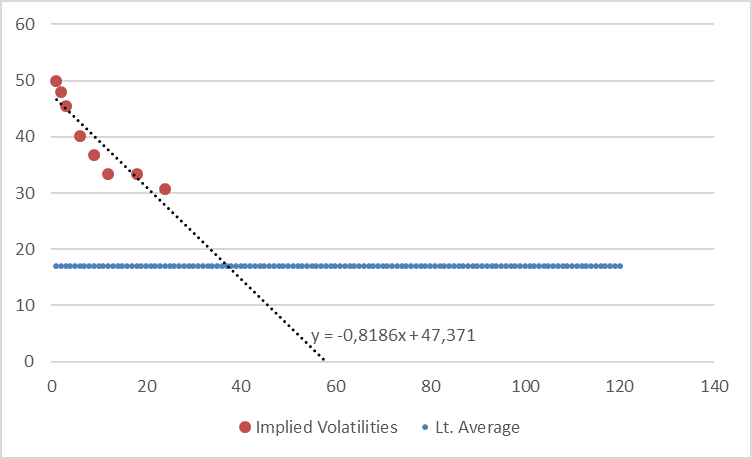
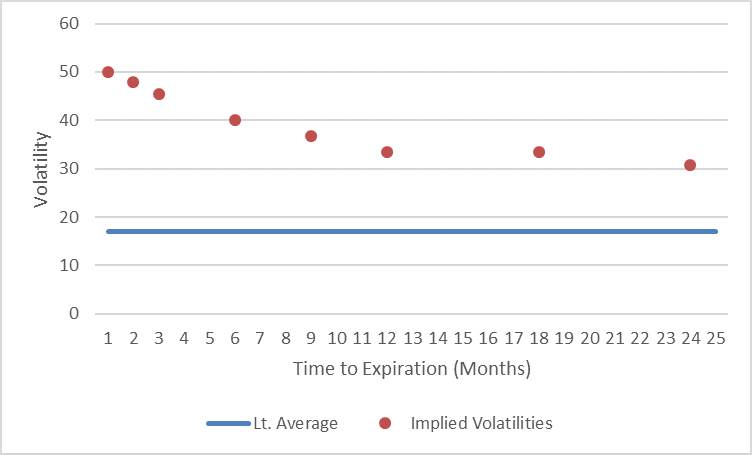
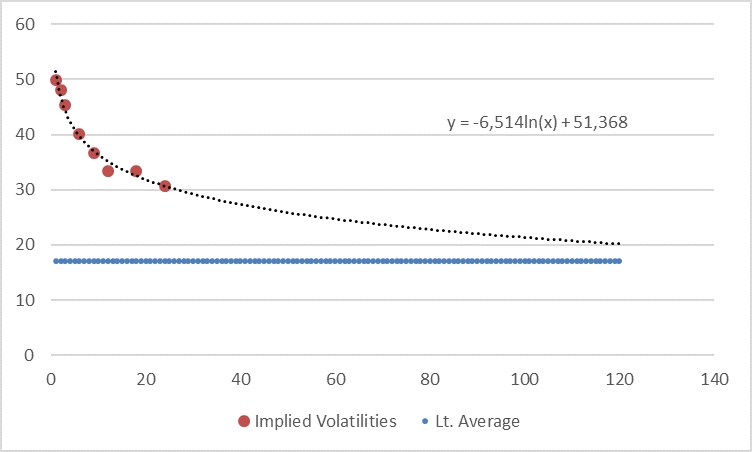
Looking at the VSTOXX term structure at 31 March 2020 (end of Q1) we can see the following data points, plus the long-run average of volatilities which is roughly at 17%.
If we now extrapolate this term structure using a loglinear regression (in order to deal with the seemingly convex shape of the first 24-months term structure) and anchor this extrapolation with an additional, manually added data point at 17% in year 10 (in order to pull down the curve in time to the long-term average) we get the following picture.
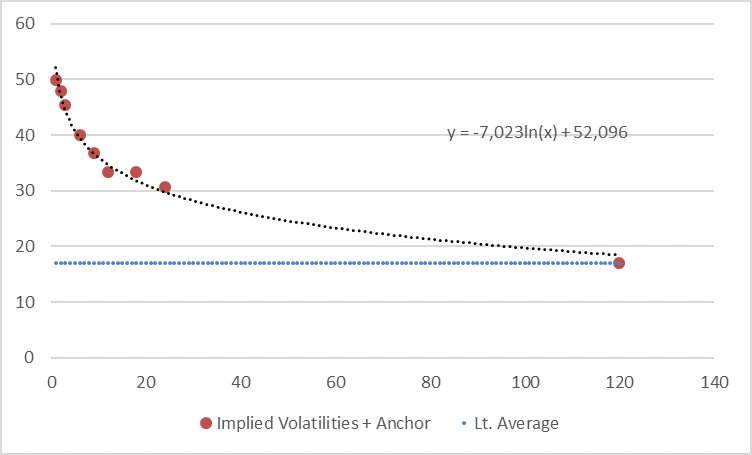
We have also run a linear regression (seems to be rather too conservative here) and a loglinear regression without anchor (approaches the 17% long-term average only in year 16) but we think the above shown extrapolation is a good compromise here. Nevertheless, we provide the other two calculations in the appendix to this post.
With this now generated long term structure we can determine the market risk premia for different time horizons (all seen from the 31 March 2020) if we make an assumption on the level of the market risk premium immediately before the start of the coronavirus-crisis. This “old” equity premium can e.g. be taken from an implied equity premium model. Assuming further that the long-term volatility average of 17% is in line with the “old” equity premium we can determine use the following formula for our calculations:
![]()
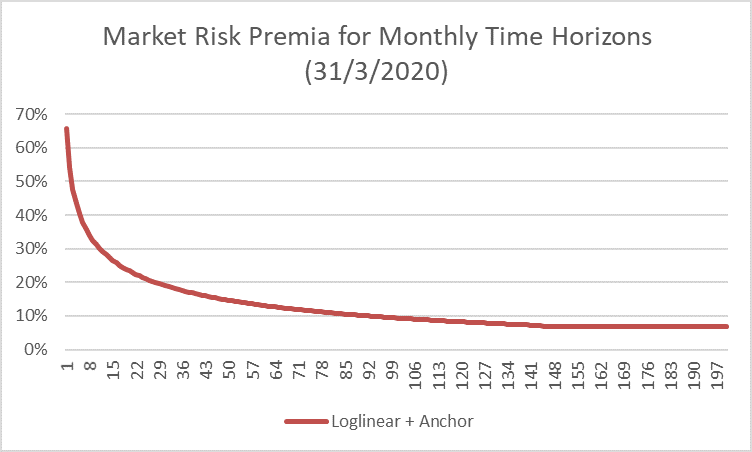
The result is the following „term structure of market risk premia“ at 31 March 2020, with the time at the x-axis measured in months. We have set the “old” market risk premium at 7% in this example.
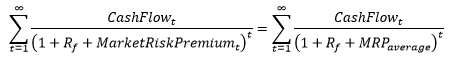
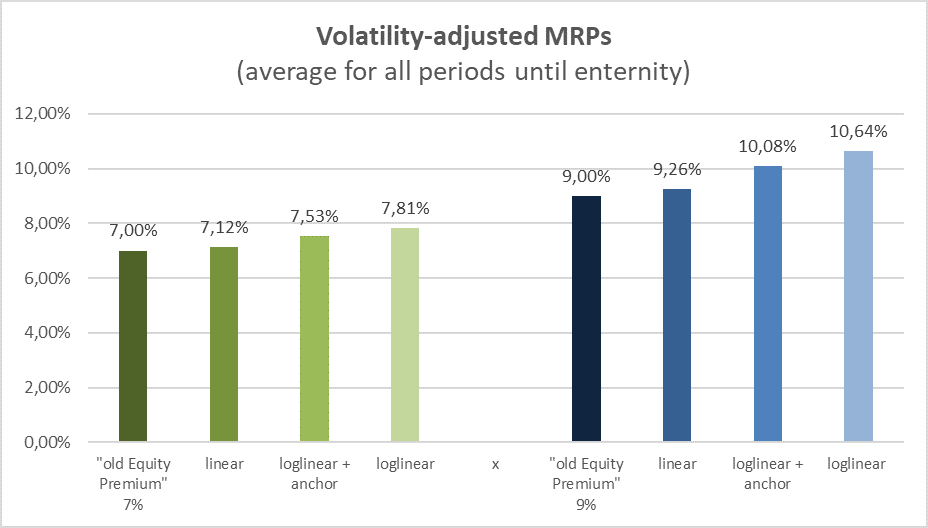
We can now use these time-horizon-dependent risk premia (in annualized form) and include them into our business valuation model for valuations at 31 March 2020. Or we can derive an “average equity premium” for the whole time horizon until eternity. For the latter we have to set some assumptions, e.g. on the sustainable growth rate of the representative cash flow (here: 1%) and the risk free rate (here: 0%). Now, we can derive this “average equity premium” MRPaverage by using the following equation:
Now, for „old equity premia“ of (let’s say) between 7% and 9% we get the following volatility-adjusted equity premium limits (we also map the results for the loglinear extrapolation without anchor and the linear extrapolation in this table, see appendix for the respective graphs).
What can we expect from Q1/20 Goodwill Impairments in Germany?
The equity premium is not only important for investors per se, it is also an extremely relevant parameter in accounting. In particular the one at 31 March 2020, the relevant date for the Q1/20 goodwill impairments.
In international accounting, the impairment-only approach to goodwill is under pressure anyway. Investors have been not very happy with this rule for quite some time. While theoretically sound, the impairment-only approach suffers from weak practical application: “too little, too late!”, so the usual complaints. In March 2020, The IASB has issued a discussion paper on “Business Combinations—Disclosures, Goodwill and Impairment”, targeting improvements to IFRS 3 Business Combinations and IAS 36 Impairments of Assets, to find a reasonable solution to the goodwill-accounting problem.
Many investors see the root to all problems in CFOs being unwilling to write-down goodwill positions and auditors being too weak (or too dependent) to counteract. Only if it can no longer be avoided at all, companies react – at least a little bit. And admittedly, we are also thinking a bit in this direction (see the blog post on general problems with impairments HERE, and our comment specifically on the 23 bn USD General Electric Impairment last year, HERE). So, it is no big surprise that the proceeding in Q1/2020 – after the capital market correction and in the middle of the big discussion about impairment-only – will be under severe scrutiny by many observers, be it from the regulator side or from the investment side.
However, and this is not really funny, the starting point to the first big impairment season of the Coronavirus-crisis is already a very bad one – at least in Germany. While we agree that the concrete value of the equity premium is really difficult to determine and that our volatility adjustment technique is also not free from fragilities, it is for us very clear that the equity premium must have increased during the crisis (as compared to before). If everybody sees a massively increasing uncertainty about future cash flows then this uncertainty increase must flow directly into the equity premium. German auditors, in contrast, have already published a statement (and such statements are a strong indication of what is applied in practice by auditors), via the Institute of Public Auditors in Germany, about what they think is a reasonable consequence for the equity premium. And it is…Nothing! No change in the equity premium!
While we do not want to speculate here why members the Institute of Public Auditors in Germany have decided this way (while actually acknowledging that the valuation uncertainty has strongly increased), we can already anticipate what this statement means for Q1/20 goodwill impairments in Germany: too little! And perhaps with this disappointment it has also become too late! Too late for fixing the broken impairment-only approach. Trust in the quality of goodwill impairments will certainly not increase if we already massively disagree in such basic valuation parameters such as the equity premium.
Appendix
VSTOXX: Loglinear extrapolation without anchor (31 March 2020)
VSTOXX: Linear extrapolation (31 March 2020)