Telefonica Deutschland (TEF DE) is a German based telecommunication company and network operator. It serves roughly 50 mio customers, most of them with a mobile contract. The company engaged in a transformative acquisition in 2014 when it bought E-Plus, one of the other big German network operators at that time. Synergies seemed to be high initially as the fixed costs of running one grid instead of two are massively lower. However, not all of the hopes have turned into reality.
We have already analysed some Non-GAAP measure topics in the past (see LINK) and in this blog post we also want to shed some light on a management chosen way of performance measurement. But also on how some subtle change in presentation of reporting (i.e the change in the fine print) can trigger some deeper analysis…
TEF DE is not really an exception in terms of how companies define their Non-GAAP measures but rather an interesting case on how companies can manage the Non-GAAP measures over time… and at which degree of readability they present it. In this particular case it is about the measure “Operating Income before Depreciation and Amortisation” (OIBDA in the TEF DE nomenclature, similar to an EBITDA measure). Let’s have a look at the development of this measure of TEF DE since 2015.
In 2016 the company could highlight a 3.8% organic growth based on adjusted figures.
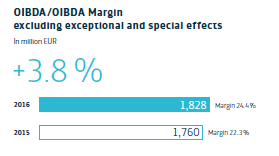
AR Telefonica Deutschland 2016, p. 37
In 2017, TEF DE could not really record a big growth, but thanks to rebasing of the benchmark 2016-number, things looked differently in the reporting.
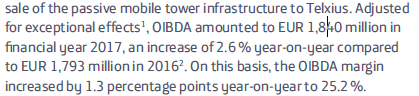
AR Telefonica Deutschland 2017, p. 51
In 2018, finally a nice growth of 5.3% (not explicitly disclosed below) could be found in the annual report.
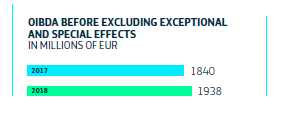
AR Telefonica Deutschland 2018, p. 48
However, if we compare the IFRS-performance of TEF DE with the announced growth rates (and with the calculated growth rates without the 2016 rebasing) we see a quite different picture.
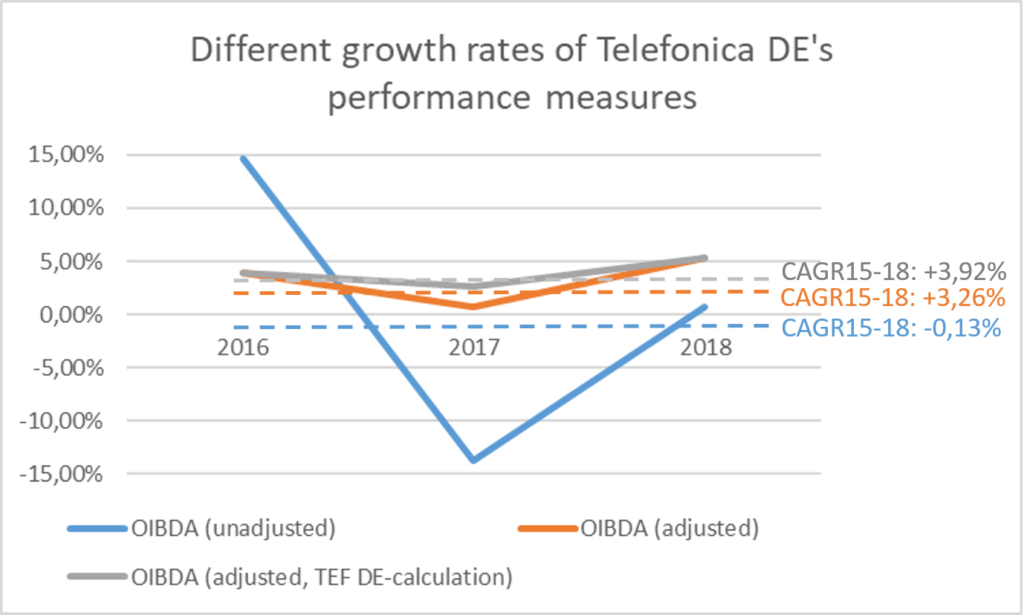
How is this difference in growth rates possible? And what does it tell us about the real performance of TEF DE? First, the numbers require some comments:
- Of course, it might make sense sometimes to adjust the IFRS-figures to get a more meaningful, or more normalized performance measure. This is the idea of Non-GAAP measures. However, if over a 4-year-period the development of Non-GAAP measures moves so massively apart, then it might be at least questionable whether the adjustments are really justified in their whole extent.
- In each period 2016 to 2018 we find non-immaterial restructuring expenses at different amounts (roughly 80-90 mio Euros every year). And it is anyway a very special understanding of companies to adjust for them. TEF DE strips the restructuring charges out from its understanding of sustainable performance measurement, but (1) obviously it is not really “exceptional” as it shows up every year, and (2) TEF DE obviously keeps the (hopefully realized) benefits of these restructuring efforts fully in its performance measures. This is a quite asymmetric understanding of what is part of normal business and sustainable performance measures. Important side note: The restructuring charges mainly relate to the 2014 takeover of E-Plus. And TEF DE once expected a positive of about 500 mio Euros of synergies to be realised from this deal until end of 2019.
- We also find a lot of adjustments due to selling-off of some business units or single assets. Such adjustments make sense per se. But it is not that something got lost in substance here. The 2014 takeover of E-Plus should be more than a compensation for these divestments in terms of operating performance.
- And then there is a stripping-out of some negative special effects due to “regulation”. Admittedly, we do not know exactly how much of a one-time nature these effects have, but for telecoms “regulation” is simply part of the business – sometimes to the good, and sometimes to the bad. Has TEF DE also stripped out any positive effects from regulation? We couldn’t find any.
- We also struggle a bit with the ex-post-adjustment of the 2016 benchmark in 2017. This is an adjustment for intra-year leasing effects from the sale of the passive tower infrastructure. This again makes sense per se, but in the 2016 numbers (and the annual growth rate calculation 2015-16) it was well accepted to not being stripped out.
- Interestingly, the adjustments are timed in a way that allows a nice minimum 2%+ growth rate every year. It might be that this is just by chance. And it is also quite normal that Non-GAAP measures follow a smoother path than IFRS figures. But here the impression of a stable business development does not seem to well match with real performance.
- It is also not the case that TEF DE has not benefited in its ordinary (and its Non-GAAP) OIBDA from any clear one-time boosts. In 2018, for example, the introduction of IFRS 15 (revenue recognition) led to a ca. 35 mio Euro positive impact to the recorded ordinary OIBDA (AR Telefonica Deutschland, p. 147, resp. Combined Management Report p. 92). Without this effect, the CAGR15-18 of the IFRS figures would even be at -0.78% (instead of the -0.13% calculated above).
So what can we learn from this? We give TEF DE the credit of following some consequent rules with the adjustments, so we do not want to blame the company for doing any misleading, not at all (although we do not think all of these rules are helpful for investors, as stated above). But we can also see that certain adjustments management and supervisory board agreed on can lead to a great misunderstanding about the actual performance of a company. And performance measures – whatever they are defined – must also serve as a measure for management stewardship. And here the IFRS numbers tell a totally different story for quite a long time horizon (4 years). Without any deeper information, an investor has to ask the big question here: Where have all the high hopes of the E-Plus acquisition gone (stewardship!)? How can we bring this steady positive growth in adjusted OIBDA since 2015 in line with the real IFRS-performance of the company? And in particular: What does this tell us about the future performance development of TEF DE (stewardship!)? Lots of questions, which we think aggravated in relevance over time.
A further important comment: We cannot really see whether the adjusted OIBDA measures flow directly into the remuneration of TEF DE management. And admittedly, we have not looked too deep into the company in order to be able to clearly understand the remuneration structure. However, in its remuneration report (here TEF DE AR 2018, p. 105, resp. Combined Management Report p. 50) the company writes that the one year variable remuneration “is calculated using the formula target bonus multiplied by the business performance.”, “The business performance factor consists of two components….the success of Telefonica Deutschland Holding AG and…the success of Telefonica S.A.” and “The parameters for the calculation of the Telefonica Deutschland component, their weighting and the respective target achievements are set by the Supervisory Board on an annual basis.” The information is similar in the years before 2018, and it is not very clear. But at least we know that the information on adjusted OIBDA is in each year 2016-2018 one of the four (in 2016: one of the three) “Financial Highlights” of TED DE, so at least a highly important internal performance measure.
And finally the fun fact: We came across this case at the first time with the annual report 2017. The kick-off spot was the change to a very fine-print in the notes to the adjustments. In this 2017 report TEF DE changed to a very light grey writing (it has been small already before) which made it now almost unreadable. And additionally, they put it to a different page than the ”at a glance” income statement. This is also the case in the 2018 report. We certainly do not know whether this has been done on purpose. But we can definitely say, that exactly such changes are always a trigger for forensic analysts to do more analysis and look deeper into the numbers. If on purpose or not, fine print only keeps away the superficial readers, but it massively attracts the deep value investors. So it is certainly not a good strategy to hide away something this way (but again: perhaps this all just happened by coincidence).
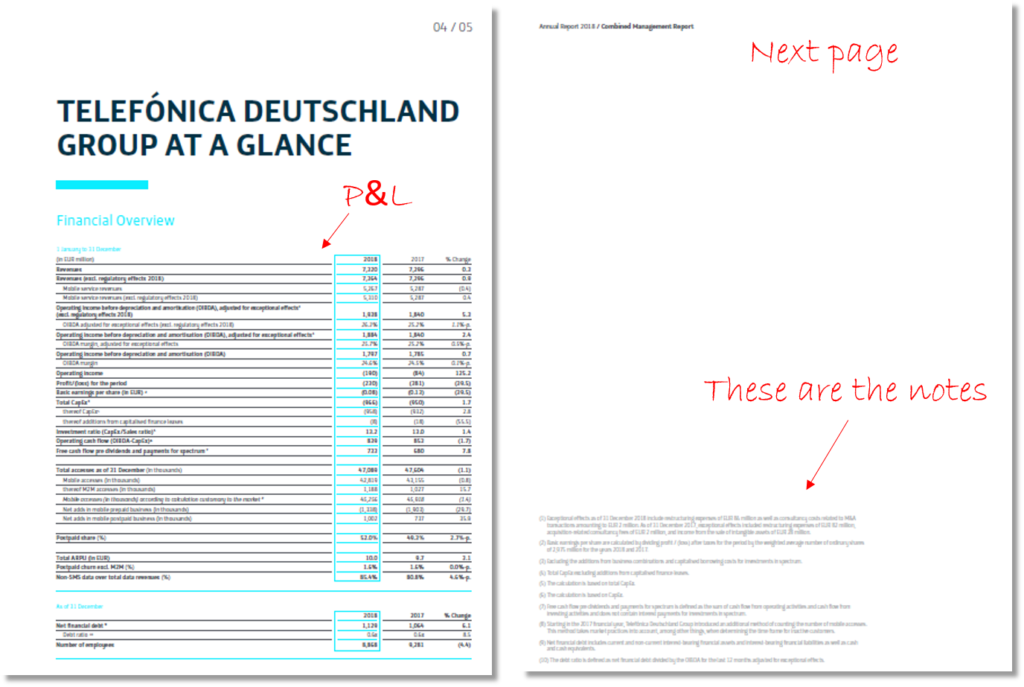
Here source for this visual presentation: AR Telefonica Deutschland 2018, p. 60/61 resp. Combined Management Report p. 5/6. The red comments are included by the author.
Disclaimer: We hold no direct economic stake in TEF DE – in whatsoever direction. We base our analysis on imperfect information and hence we might be wrong with some conclusions. This is just our subjective view and no investment recommendation at all.